

Front-end Service
The Front-end service is an HTTP service running on a CapaInstaller Management Server. Simply put. Its job is to act as an information/data hub for CapaInstaller Clients running the BaseAgent. This is our replacement for the SMB access to Management servers for installation files and files generated/to be consumed by the CapaInstaller Replicator Service (REPL). There are a few key points in this scenario:
- The Front-end/BaseAgent traffic does not rely on Windows Domain user rights making cross-domain client access an un-issue.
- The Front-end can be put in a DMZ and handle client traffic for clients currently on the outside of the firewall. Even without having to put software packages in the DMZ by relaying file requests for a Front-end on the inside of the LAN.
- Traffic between the BaseAgent and the Front-end is protected. For the best protection, use HTTPS URLs, see Use HTTPS in Backend, Frontend & OS Deployment Service.
- Front-end can intercept calls to .jps files and generate them on the fly from SQL data in order not to link all outside clients to the Front-end in the DMZ.
- Front-end runs as a native Windows Service and does not rely on an Internet Information Server (IIS), thus it can be deployed directly from the System plugin.
- The Front-end can track units being Online/offline and remote agent runs (from CM) can be carried out even if the Client is outside the firewall.
- Front-end also acts an information/data hub for the Mobile Device Management Service (MDM), making profiles commands and software packages available for iOS, Android, and Windows Phone devices.
Requirements
Section titled “Requirements”- The Front-end Server is a Windows Service that runs on x64 and x86 processors.
- The service requires Microsoft .NET Framework 4.6.2 to be installed.
- A Management Point must exist before you can deploy the service.
Locations
Section titled “Locations”- The service is deployed from the System Administration plugin in the CapaInstaller Console. See Deploy Front-end Service.
- The service is installed in
C:\Program Files\CapaInstaller\Services\CiFrontEnd. - The main log file
CiFrontend.logand the client log fileCiFrontend Client.logare written inC:\Program Files\CapaInstaller\Logs\Services. You can change the log root in the service settings. - The default ports are
5021for the internal URL and5022for the public URL. See Ports and encryption.
Service settings
Section titled “Service settings”To open the settings, right-click the Front-end Service in System Administration and select Service settings…. Besides the General, Database, and Communication tabs, the Front-end Service has these tabs:
| Tab | Settings |
|---|---|
| Frontend log | Log File Level, Max Log File Size (MB), Max Log Files in \History, and Log File Root Directory. The default log root is %ProgramFiles%\CapaInstaller\Logs. |
| Frontend Misc | Default Point (the Management Point where new devices without an enrollment configuration are enrolled), Relay URL to inside of the DMZ, Maximum Threads, Cache Folder Location (default %TEMP%\cifrontend), Skip Firewall Opening, and Skip Automatic Update. Intercept unit calls and Require Client Authorization are always selected. |
Settings that you set on the command line are saved in the database and shown in these tabs.
Functionality
Section titled “Functionality”Deployment, relays, encryption, and FEStatus are described on these subpages.
Command Line Interface
Section titled “Command Line Interface”The service retrieves its configuration from the SQL server but can take different command-line arguments. As the Front-end Server is a windows service, any arguments must be supplied to either the net.exe command or the sc.exe command.
Controlling client bandwidth
Section titled “Controlling client bandwidth”To avoid total anarchy, the Front-end Server provides a control mechanism to secure the flow of data for all clients. This is done by limiting (throttling) the bandwidth for clients downloading files. This throttling does not have any effect on the content being downloaded, but is merely adjusting the time being spent on each client. The limit is enforced for every 256KB of data on each download. The bandwidth limit can be set from the command line with the parameter /maxbandwidth=<value> where the value can be something like this; 800k, 2.5m, or 1g (800KB/s, 2.5MB/s or 1GB/s). Furthermore, this value is available on the /config?max bandwidth URI where it can be read and set on runtime.
Parameter syntax
Section titled “Parameter syntax”To show the full syntax in the log file, start the service with /?.
sc [\\computer] start cifrontend [/fatal|/f|/error|/e|/info|/i|/debug|/d|/trace|/t] [/skipupdate] [/skipfirewall] [/skipunitsonline] [/internalport] [/publicport] [/configport] [/cmpid] [/maxthreads] [/logroot] [/logconfig] [/loglevel] [/cachelocation] [/startupdelay] [/maxbandwidth] [/httppassword] [/relayurl] [/set|/clear]| Parameter | Meaning |
|---|---|
| /debug or /d | Sets the log level to debug. You can also use /fatal or /f, /error or /e, /info or /i, and /trace or /t. |
| /skipupdate | Skips the check for a new version from the database. |
| /skipfirewall | Skips the opening of firewall ports during initialization. |
| /skipunitsonline | Skips the processing of online status for Windows agents. |
| /internalport=80-49151 | Overrides the internal port, to be accessed from inside the firewall. You can specify up to two ports. Normally, you set the port in the internal URL on the Communication tab. |
| /publicport=80-49151 | Overrides the public port, to be accessed through the firewall. You can specify up to two ports. Normally, you set the port in the public URL on the Communication tab. |
| /configport=## | The port to open to make the config interface available. |
| /cmpid=id|fqdn | Sets the default Management Point. Supply either the ID or the FQDN of the Management Point. |
| /maxthreads=2048-102400 | Sets the maximum number of threads that handle incoming HTTP requests. The service uses at least 8182 threads. |
| /logroot=<path> | Sets the root folder for log files. The default is %ProgramFiles%\CapaInstaller\Logs. |
| /logconfig=<size,generations> | Sets the size in MB and the number of generations of the log file. The default is 5,10, which is 5 MB and 10 generations. The maximum values are 10,100. |
| /loglevel=fatal|error|info|debug|trace | Sets the log level of the log file. The default log level is info. |
| /cachelocation=<path> | Sets the folder where the cache stores the incoming objects. The default is %TEMP%\cifrontend. |
| /startupdelay=1-3600 | Adds a delay, in seconds, before the service starts. This argument has no other function and is primarily meant for debugging. |
| /maxbandwidth=<value> | Limits the bandwidth per client, for example 500 (bytes per second), 256K, or 1M. The default is no limit. The limit applies only while files are transferred. |
| /httppassword=<password> | Saves a hash of the password in the registry. The password protects endpoints such as /cifrontend/agent and the download of FEStatus - A real time view. |
| /relayurl=<url>:<port> | Redirects file requests to another Front-end Service. For use in the DMZ. See Relaying files. |
| /set | Saves the stated arguments as default. |
| /clear | Clears the default arguments. |
The arguments /internalencryption, /publicencryption, /authorization, /intercept, /root, and /skipstatistics from earlier versions are no longer supported. Unit call interception and client authorization are always enabled.
Examples
Section titled “Examples”sc \\frontend01 start cifrontend /dStarts the service on the server frontend01 in debug mode.
sc start cifrontend /cachelocation="D:\FrontEndCache"Starts the service and uses D:\FrontEndCache as the cache location.
sc start cifrontend /maxbandwidth=5mSets the maximum bandwidth per client to 5 MB per second.
sc start cifrontend /startupdelay=10 /dStarts the service, delays the initialization by 10 seconds, and runs in debug mode.
Log levels
Section titled “Log levels”Servicing hundreds of thousands of units makes the FrontEnd a busy server. Logging all actions can slow down the server and produce a vast amount of log data. To control the amount of logging, the server uses a log level to select which details to log.
The log level can be set at five different levels;
| Log level | Meaning | Example |
|---|---|---|
| fatal | Incidents that are fatal for the service | Error reading configuration in SQL server Error retrieving the server node for; server.domain.com |
| error | Incidents that cause an error for either the server or a client. | Error Checking auto-update Error enrolling device (xx) without a known user |
| info | Every action has an impact on the server or a client. This includes the initialization of the service. |
Existing unit ‘JC’ (running WINDOWS 6.1.7601) (4C4C4544-0043-3010-8050-B2C04F53334A) enrolled on the DevPoint Point The unit ‘DEVTBS’ is now linked to the container \devtbs\devpoint |
| debug | Debugging information that shows activity but no state changes. | Inserted HWinventory UnitCommand for the iOS device: JH’s iPhone” APNS: The device ‘dev iPhone’ was told to call home. Tasks: 7 tasks returned for unit: wstst02 Request Win : GET 200 OK (JC) /agent/4C4C4544-0043-3010-8050-B2C04F53334A/file/ms.jpg 89336 0 175 |
| trace | Everything that happens. | Statistics: Memory usage: 57MB -> 62MB PSLimits: 12 PayloadSettingsLimits loaded in 157ms Raw Url 1 : POST - 10.10.100.25 - /cifrontend/agent |
When selecting a log level, the higher log levels are included. This means that, if you select the log level; info (command line; /loglevel=info), then Error and Fatal incidents are shown as well;
In debug/trace mode, received inventory data is dumped in \dump that resides alongside the two cache folders; ‘incoming’ and ‘outgoing’. Files dumped herein lives for 24 hours. That leaves enough time to make it possible to harvest incoming inventory data but at the same time minimizes the footprint on the file system.
When leaving debug mode, the folder and its content are destroyed.
The /info URI
Section titled “The /info URI”The /info URI is used to request the health of the FrontEnd Service. It can be called with a number of specifiers;
| Uri | Response | Value |
|---|---|---|
| /info/version | Returns the version of the service |  |
| /info/time | Returns the time and date of the server |  |
| /info/server list | Returns a list of all frontend servers | 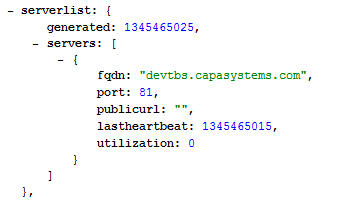 |
| /info/uptime | Returns the uptime for the service |  1 1 |
| /info/heartbeat | Returns time since the last heartbeat |  |
| /info/memoryusage | Returns the memory usage of the service |  [^2][^)] [^2][^)] |
| /info/status | Returns current state |  |
| /info/sqlstatus | Shows SQL connection status |  |
| /info/cachefiles | Returns the number of files in the incoming cache |  |
| /info/cacheworkers | Returns the number of workers on the incoming cache |  |
| /info/cacheutilization | Returns how busy the cache is |  |
| /info/threadswaiting | Returns the number of threads awaiting execution |  |
| /info/threadsactive | Returns the number of active threads |  |
| /info/threadutilization | Returns the utilization of threads on incoming calls (%) |  |
| /info/utilization | Returns how busy the service is (%) |  |
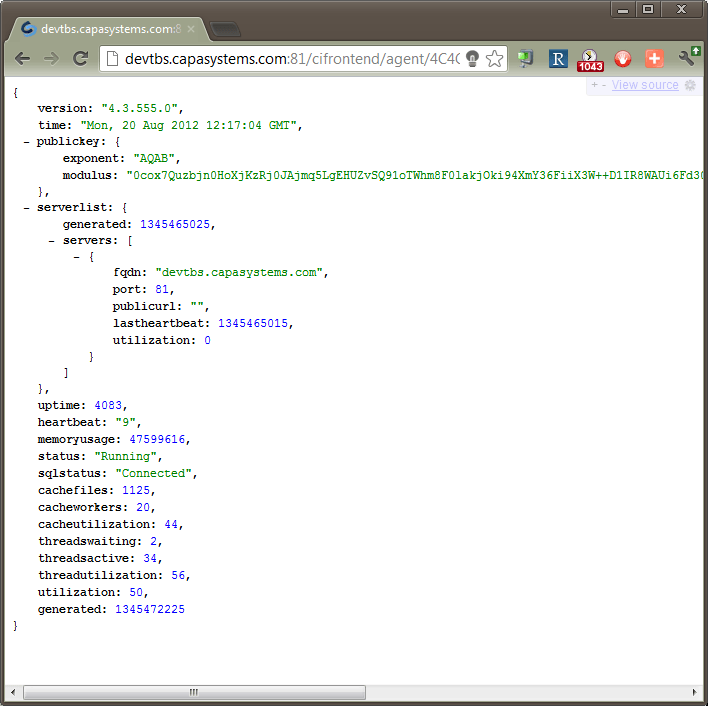
| /info/all | Returns all info variables | (see below) |
These variables can be requested in raw form (last column), to be used from the management console by adding? raw to the URI
In addition /info/all can be used. The result will look like this;
Statistics
Section titled “Statistics”For each client call made to the FrontEnd server, statistics are collected in a statisticsItem. The properties collected are;
| Property | Value | Description |
|---|---|---|
| HttpMedtod | POST or GET | This makes it possible to distinguish between the incoming and outgoing flow |
| IncomingData | Bytes | The amount of data received in the call |
| OutgoingData | Bytes | The amount of data returned in the call |
| WaitTime | Milliseconds | The time from the call was registered to work begun |
| ResponseTime | Milliseconds | The time from the call was registered to response was given 1 |
| ThreadCount | Integer | The number of threads currently servicing client calls |
| TimeStamp | Integer | The number of seconds elapsed since January 1. 1970 |
| WaitCount | Integer | The number of threads currently waiting to get served |
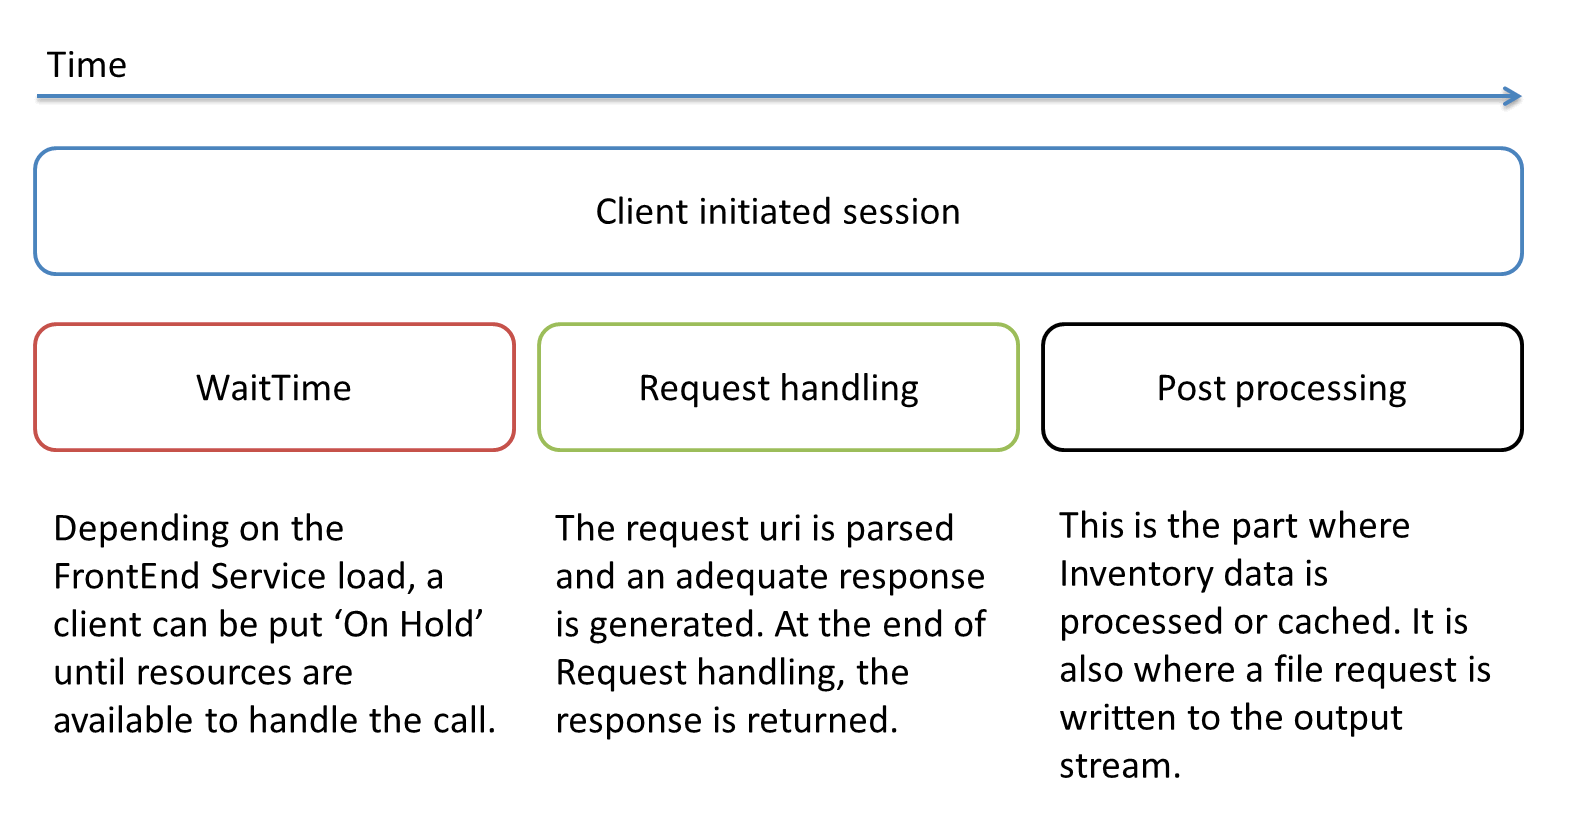
Each StatisticsItem is collected and summarized and every 30 seconds, the summarized data is written to the SQL server along with application-specific data, which include;
| Property | Value | Description | Threshold |
|---|---|---|---|
| Count | Integer | The number of sessions the summary represents | None |
| MemoryUsage | Bytes | The number of bytes allocated by the FrontEnd Server | Reported if changed more than 10% |
| Utilization | Integer | The degree of utilization as the number of active threads divided by the maximum number of threads allowed | Reported if changed more than 10% or if it has reached 0 |
| FilesInCache | Integer | The number of unhandled cache elements currently in the cache | Reported if changed more than 10% or if it has reached 0 |
| CacheWorkers | Integer | The Number of threads currently working on the cache | Reported if changed more than 10% or if it has reached 0 |
Debug mode
Section titled “Debug mode”The debug mode of the FrontEnd Server serves as an aid in error debugging. The changes in behavior are primarily seen in the log file but a few additional features are used in debug mode.
In Debug mode, received inventory data is dumped in \dump that resides alongside the two cache folders; ‘incoming’ and ‘outgoing’. Files dumped herein lives for 24 hours. That leaves enough time to make it possible to harvest incoming inventory data but at the same time minimizes the footprint on the file system.
When leaving debug mode, the folder and its content are destroyed.
Saving incoming data in the \dump folder decreases performance, thus Debug mode is NOT recommended unless actual debugging takes place.