Detailed Graph
The detailed graph shows every recording of the Utilization Index for a selected computer. Use it to find spikes at certain times of the day, when the performance of the computer is poor. When you find a spike, zoom in on that period. Hover the mouse over the spike to see the CPU, memory, and hard disk usage and find out what causes the drop in performance.
If spikes occur at the same time every day, software such as an antivirus scan or an automatic software update is a likely cause. Many other causes are possible.
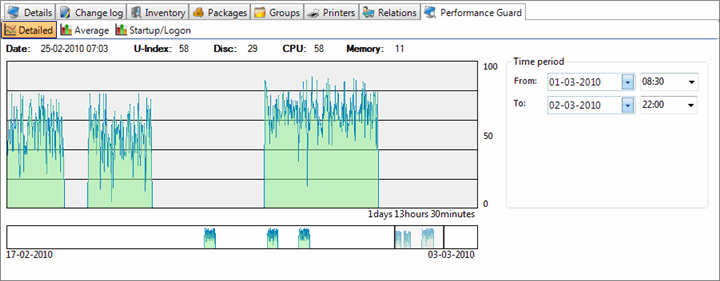
The screenshot shows the detailed graph for a selected computer, zoomed in on 1 and 2 March. The view has three main sections.
Overview graph
Section titled “Overview graph”At the bottom of the view, a small graph covers the current date and the previous 14 days. The earliest and latest dates are shown on the left and right sides. If any data has been collected for the computer in this period, you can see it here.
Use the overview graph to zoom in on the detailed graph above it. Click and hold the right mouse button, drag, and release the button. The detailed graph zooms in on the selected section. The part you have zoomed in on is gray and marked with two vertical black lines.
Time period
Section titled “Time period”The time period controls show the period that the detailed graph displays. The controls are updated whenever the period changes, no matter what caused the change. When you change the controls, the detailed graph changes accordingly.
Detailed graph
Section titled “Detailed graph”The graph shows the Utilization Index for the period set by the time period controls and the overview graph. The duration is shown in days, hours, and minutes in the bottom-right corner. The y-axis shows percent from 0 to 100, and the x-axis shows time.
You can also change the time period directly on the graph with the mouse:
- Drag with the left mouse button: Click and hold the left mouse button, and then drag to the right to move the graph backward in time. Drag to the left to move it forward in time.
- Zoom with the scroll wheel: Click the graph to give it focus. Scroll forward to zoom in, and scroll backward to zoom out. Each step adds or removes 30 minutes at both ends of the period, one hour in total.
- Zoom with the right mouse button: Click and hold the right mouse button, drag, and release the button. The graph zooms in on the selected section, the same way as on the overview graph.
The labels directly above the graph show the data at the position of the mouse pointer. As you move the mouse over the graph, the labels show the exact date and time, the Utilization Index, and the disk, CPU, and memory usage.
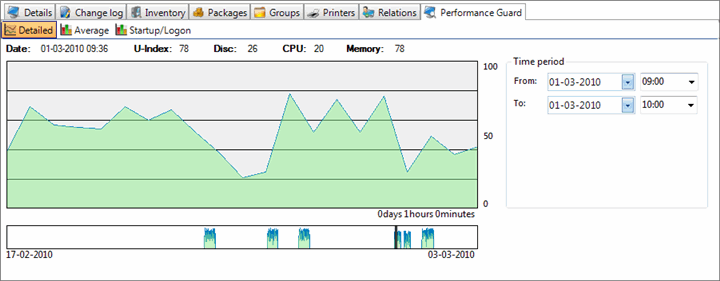
In the following screenshot, the detailed graph is zoomed in on a period of one hour, and the mouse pointer is on a peak at 9:36. The labels at the top show that the Utilization Index is 78, and that the high value is caused by high memory usage at that time.