

Average Graph
The average Utilization Index is calculated for each day and stored in the CapaInstaller database. The average can help you identify general performance issues on the computers in your organization.
The average graph shows the average Utilization Index of a computer as a series of columns. Each column represents the average Utilization Index for one day. Hover the mouse over a column to see the date and value that the column represents.
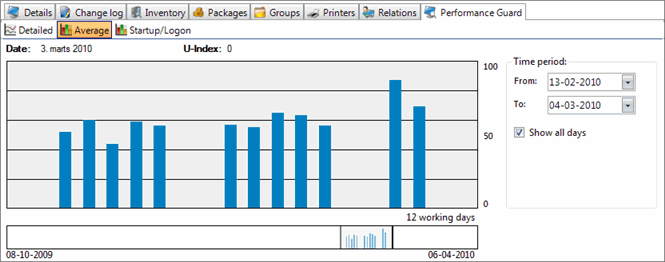
The screenshot shows the average graph for a selected computer, zoomed in on 13 February to 4 March. The view has three main sections.
Overview graph
Section titled “Overview graph”At the bottom of the view, a small graph covers the current date and the previous 6 months. The earliest and latest dates are shown on the left and right sides. If any data has been collected for the computer in this period, you can see it here. The part you have zoomed in on is gray and marked with two vertical black lines.
Time period
Section titled “Time period”The time period controls show the period that the average graph displays. The controls are updated whenever the period changes, no matter what caused the change. When you change the controls, the average graph changes accordingly.
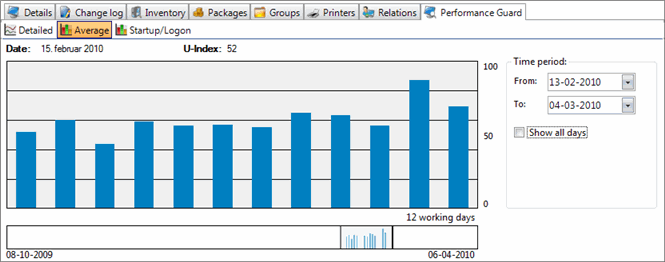
You can also choose to show all days on the graph, or only the days with data. Clear the check box to show only days with data. This can make it easier to notice a trend in performance. The following screenshot shows the same time period with the check box cleared.
Average graph
Section titled “Average graph”The graph shows the average Utilization Index for the period set by the time period controls. The number of days with data is shown in the bottom-right corner. The y-axis shows percent from 0 to 100, and the x-axis shows days.
You can also change the time period directly on the graph. Click and hold the left mouse button, and then drag to the right to move the graph backward in time. Drag to the left to move it forward in time.
The labels directly above the graph show the data at the position of the mouse pointer. As you move the mouse over the graph, the labels show the date and the average Utilization Index of the day that the column represents.