

Startup logon Graph
The startup/logon graph shows the startup times and logon times of a computer. Each column represents a startup time, a logon time, or both. Blue represents startup time and green represents logon time.
A logon often follows directly after a startup. If the user logs on within 5 minutes after the computer starts, the two times are stacked in one column, and each part keeps its color. This gives you an overview of the total time from when the user starts the computer until it’s ready for use, which is what matters most to users.
Having both the startup time and the logon time available makes it easier for administrators to find the cause when a user reports a long total startup and logon time.
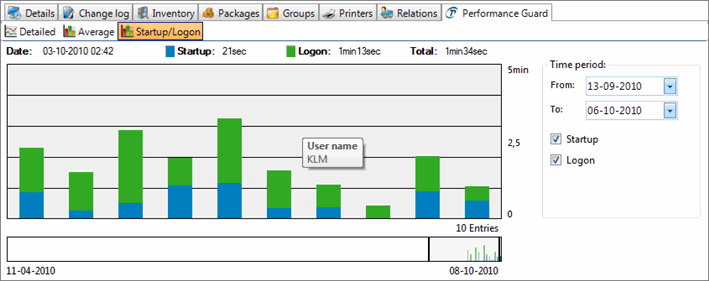
The screenshot shows the startup/logon graph for a selected computer, zoomed in on 13 September to 6 October. Hover the mouse over a column to see the name of the user who logged on. The view has three main sections.
Overview graph
Section titled “Overview graph”At the bottom of the view, a small graph covers the current date and the previous 6 months. The earliest and latest dates are shown on the left and right sides. If any data has been collected for the computer in this period, you can see it here. The part you have zoomed in on is gray and marked with two vertical black lines.
Time period
Section titled “Time period”The time period controls show the period that the startup/logon graph displays. The controls are updated whenever the period changes, no matter what caused the change. When you change the controls, the graph changes accordingly.
The startup and logon check boxes control which type of data the graph shows. To focus on logon times only, clear the startup check box.
Startup/logon graph
Section titled “Startup/logon graph”The graph shows the startup and logon times for the period set by the time period controls. The number of entries is shown in the bottom-right corner. The y-axis shows minutes, and the x-axis shows startup or logon entries.
You can also change the time period directly on the graph. Click and hold the left mouse button, and then drag to the right to move the graph backward in time. Drag to the left to move it forward in time.
The labels directly above the graph show the data at the position of the mouse pointer. As you move the mouse over the graph, the labels show the date and the startup and logon times of the entry that the column represents.