

I Want to Know if Servers Can Handle Pressure
The Response Times Versus Load graph (ANALYZE > Graphs > Statistics > Response Time Versus Load) can help you uncover otherwise hidden scaling problems.
If response times increase to a non-acceptable level when the number of requests per second increases, it’s very likely the result of an overloaded server getting more requests than it can handle.
In the graph, the horizontal axis shows the number of requests per second, and the vertical axis shows the response time in milliseconds. Each server is drawn in its own color.
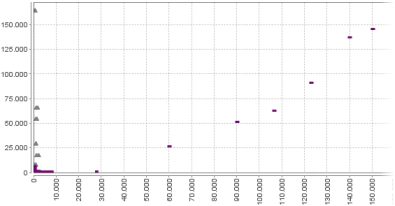
In the example, the response times of the purple  server dramatically increase when the server gets many requests—a typical sign of an overloaded server that could benefit from a hardware upgrade in order to perform better at busy times.