

Citrix Server Graph
The Citrix Server graph (ANALYZE > Citrix > Graphs > Server Graph) lets you compare Citrix Performance Measurement session quality data with other types of session quality data, network application data, or against usage counters (CPU, memory, context switches, …).
-
On the Setup tab, select required Citrix Server. Then select required Citrix Domains and ICA Client Groups (either all ICA clients or clients at a particular location or network).
-
Select the data sets that you want to cover in the graph. You can specify a Primary Type data set as well as an optional Secondary Type data set. With two data sets, you are able to compare different data, for example latency and response time. The data set types are described in the following sections.
-
Optional: Enter Y-axis Min and Max values for the primary and secondary data sets. If you leave the fields empty, the range automatically reflects the minimum and maximum values found in the data.
-
Select the required Interval (that is the period of time that you want to cover). If the predefined intervals don’t suit you, select Custom to Custom Time Periods on Graphs.
-
By default, the samples in the graph are connected by a line. To show the samples as separate points, select Disconnect samples.

Connected samples

Disconnected samples
-
Click the Update button.
The graph opens on the Citrix server tab.
Primary type
Section titled “Primary type”The Primary Type data set can be one of these Citrix session values:
- Latency
- Total Sent bytes and Total Received bytes
- Avg. Sent bytes and Avg. Received bytes
- Session startup time
- Established and Terminated (sessions)
- Active sessions
If you select a single Citrix server, you can also select one of the server usage counters: CPU Usage [%], Paging Free [MB], Phys. Mem Free [%], Virtual Free [%], Write I/O [bytes/sec], Read I/O [bytes/sec], Context Switches [per. sec.], Sent bytes [KB/sec] or Received bytes [KB/sec]. The usage counters aren’t available when you select All or a manually created group of Citrix servers.
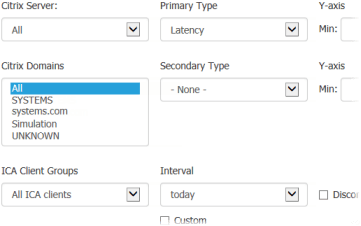 Setting up Citrix server graph parameters for primary data type (Latency)
Secondary type
Section titled “Secondary type”The Secondary Type data set can be - None -, one of the types that are available for the primary data set, or application data.
If you select Application data … (choose below), three new selection options appear: Application data type, Server and Port. The application data types are Response time, Requests / sec, Sent bytes / sec, Sent packets / sec, Received bytes / sec, Received packets / sec, Packets / request, Bytes / request, Connections / sec, Connection resets (%) and Retransmissions (%).
The Server and Port lists only contain the servers and ports that are currently being monitored. See Server Lists and Port Lists.
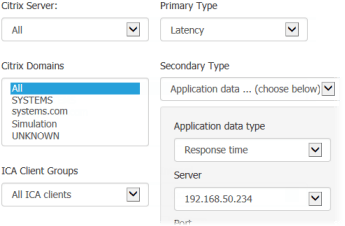 Setting up Citrix server graph parameters for secondary data type (Application data). In this example, the response time of a server is compared with latency.