The Response Time Histogram displays response times for selected servers.
To view the histogram, select ANALYZE > Graphs > Statistics > Histogram.
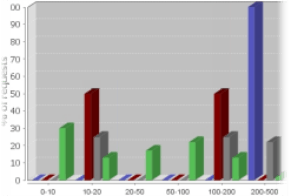
The histogram consists of 10 individual bars.
Each bar represents the percentage of replies within a given milliseconds interval.
This way you can very quickly find out if a particular server is potentially overloaded—like the blue one  in the example image.