Monitor Network Traffic and Resource Usage per Process
With PerformanceGuard you can monitor network traffic by computer process. This is highly relevant, for example if your organization wants to optimize bandwidth resources, and you need to identify if specific processes—and thereby specific applications—on specific users’ computers consume excessive amounts of your bandwidth.
The measurements cover TCP as well as UDP traffic.
Depending on your needs, there are several ways to view network traffic by process data in the PerformanceGuard web interface:
Load Overview pie chart: a good starting point
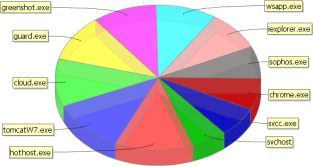
Section titled “Load Overview pie chart: a good starting point”The Load Overview (ANALYZE > Overview > IP Traffic > Load Overview) is a good starting point. You can view a pie chart of the processes that cause the greatest network load. You can filter the data on specific locations/computers, requested servers, data types and periods of time.
Processes that contribute to bad performance
Section titled “Processes that contribute to bad performance”With the Process Traffic hotspot (ANALYZE > Overview > HotSpots > Process Traffic, see Hotspot Overviews) you can find the processes that contribute to bad performance (for example the processes that generate the largest amount of traffic and/or the processes that are responsible for the most requests).
Processes over time
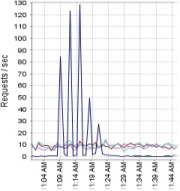
Section titled “Processes over time”With the IP Traffic by Application/Location/Process (Time View) graph (ANALYZE > Graphs > Time View > IP Traffic by process) you can view developments over time in response times, requests per second, sent and received bytes and packets, etc. for specific processes from specific locations/computers. You can compare selected processes, and you can filter the data on specific servers and ports with which computers have communicated.
Processes in computers’ communication with servers
Section titled “Processes in computers’ communication with servers”With the Server Activity Overview (ANALYZE > Overview > IP Traffic > Server Activity) you can view detailed data about servers with which groups of computers have communicated. You can then select specific processes that have been involved in the communication, and view details such as sent/received bytes and packets, response times, etc. for each process.

Processes on individual computers
Section titled “Processes on individual computers”With the computer-specific, sortable Computer Traffic Table you can view network traffic-related details of processes that have run on individual computers. You can filter the table to focus on a specific process.

To view the table, select ANALYZE > Computers > Computer Search, and search for a computer. Then, in the search results, click the name of the required computer, and then select the Traffic Table tab.
Most resource-consuming processes, with drill-down to computer details
Section titled “Most resource-consuming processes, with drill-down to computer details”With this method, you can:
- Identify the processes that consume the most resources on your organization’s computers
- View which of your organization’s computers that have run a given process
- View details of a given computer’s recent network usage
Although initially less related to network traffic measurement, the Process Resources hotspot (ANALYZE > Overview > HotSpots > Process Resources, see Hotspot Overviews) is useful when you want to identify the processes that consume the most resources (such as CPU, memory, IO) on your organization’s computers. You can choose to view a top-x list (such as a top 10 list) or a list that contains values that exceed a specific threshold value.
You’ll see the results in a table format, and if you click a process value in the table, you can view a list of all computers that have run the process in question and the resource consumption on each computer.

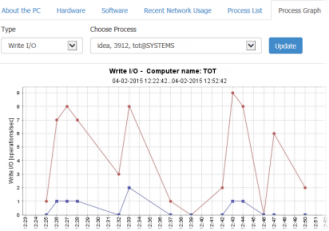
You can drill down even further: If you click a computer name, you can view computer-specific process graphs, details of the computer’s recent network usage and much more.