
Web Activities (Time View)
PerformanceGuard normally collects data on a TCP packet-basis, but if your organization has defined Web Applications, you can dig further down into web requests and return information about specific elements, such as URLs, cookies, etc.
The Transactions graph (ANALYZE > Graphs > Time View > Transactions) helps you with this.
- Transaction filter: Select required transaction filter.
- Server & Port: Select required server and port combination. You can only select server/port combinations for which the selected transaction filter is defined.
- Agents: Select the group of computers that the graph should be based on. Super groups, that is groups of groups, are enclosed in <>.
- Y-axis Min and Max: Enter the required range for the graph’s vertical axis. If you leave the fields empty, the range will automatically reflect the minimum and maximum values found in the data.
- Type: Determines which type of data the graph will contain. You can view descriptions of the available types in Graph Terms and Definitions.
- Hide thresholds …: Only relevant for one type of data: Transaction response time.
For such data, a threshold—that is a baseline that the displayed values must ideally be below—can be displayed as a horizontal line in the graph when:
-
- Your PerformanceGuard administrator has defined such thresholds
- You have selected one tag in the Transactions field (if you have selected multiple tags, threshold display is not available, because thresholds can be different across tags)
You may sometimes see more than one threshold on a graph. This is because your PerformanceGuard administrator is able to set up multiple thresholds for the same type of data. This can be useful in order to indicate different severities, for example if values above 80 are acceptable for short periods of time, whereas values above 90 require immediate attention.
On the graph each threshold has a name, so it is easy for you to see what the threshold is about.
Display of thresholds is by default on. When you generate or view a graph, you can toggle threshold display off by selecting Hide thresholds. This can be useful, for example if you think that a threshold blocks your view of the graph’s data points.
If a graph has thresholds, the thresholds will also appear if you use the graph in a report, except when they’re hidden.
- Transaction: Select one or more transaction tags from the selected transaction filter. To select multiple tags, press CTRL on your keyboard while you select.
- Interval: Select the period of time that the graph should cover. If the predefined intervals don’t suit you, select Custom to Custom Time Periods on Graphs.
- Disconnect samples: The samples in the graph will by default be Automatic. If you don’t want this you can select Connect All
 or set them to Disconnect All
  .
.
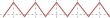
Connected samples
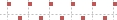
Disconnected samples