
Computer Bubble Chart Widget
Formerly known as Application Impact for Computers
The Computer Bubble Chart Widget makes it easy to determine if a selected computer has had performance problems. If it has, the widget makes it easy to see exactly which kinds of problems the computer has had, and exactly when they happened.
This widget is similar to the “Application Impact for Locations” with the focus on showing a timeline for all applications accessed by the computer within the selected time period.
The widget looks at the number of the applications that are affected by triggered events e.g. with longer response time or availability for the specified computer and displays them as a bubble markers on a timelime.
Remember what an event is? It’s a threshold violation, for example a response time that isn’t acceptable. When an event happens, the widget looks at how many online applications are affected by the events, and the bubbles then adjust color accordingly.
image2019-11-28_14-2-20.png
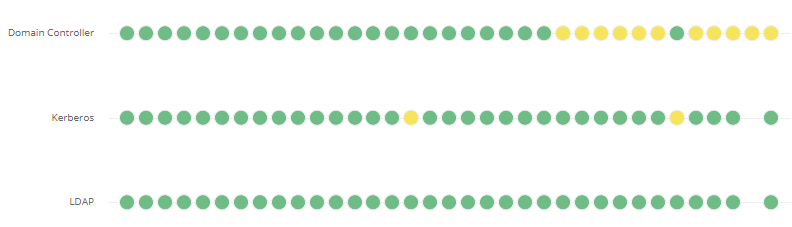
These bubbles change their color according to the severity of events during 15 min prior:
 Green bubble: Shows an Online activity
 Yellow bubble: Minor Severity (at least 1 event between 1-7 minutes)
 Orange bubble: Major Severity (at least 1 event between 1-7 and 8-13 minutes)
 Red bubble: Critical Severity (at least 1 event between 1-7, 8-13 and 14-15 minutes)
Set Up the Widget
Section titled “Set Up the Widget”You have to Network Applications before you can set up the widget. PerformanceGuard automatically creates an Application Online event when an application has been created.
Technically, your administrator sets up PerformanceGuard applications to define this.
You must define Event Rules in Manage Thresholds and Events before adding the widget on your dashboard.
-
Your PerformanceGuard administrator has predefined Event rules i.e. select ADMINISTRATION > Event Management > Event Rules (or create a new Manage Thresholds and Events).
-
For Client/Server applications:
- Response Time, Availability and Application Online
-
For Web applications:
- Response Time, Availability and Application Online
-
How does PerformanceGuard determine if a computer is affected or not? PerformanceGuard looks at the performance data it receives from agents installed on your organization’s computers. It continuously evaluates the number of computers affected by events over a period.
PerformanceGuard comes with a number of built-in event rules, so your administrator doesn’t necessarily have to set up event rules of his own.
Select what You Want to View
Section titled “Select what You Want to View”Your PerformanceGuard administrator has typically set up the widget to view the timeline.
When that’s the case, you can simply use the Computers menu in the top part of the dashboard to view the number of affected computers for selected Time Period.
You can view the details of events - simply click on it. This will display information about:
- Event Timestamp: View when each event happened as it displays the date and exact time interval when the event occurred.
- Event Description: See how great the threshold violation was as it displays the average response time / availability for the selected computer that has exceeded it’s set limit.