
Agent Configuration Group Settings
From the PerformanceGuard web interface’s list of existing Manage Agent Configuration Groups (ADMINISTRATION > Agent Configuration > Configurations) you can edit individual agent configuration groups.
Settings are split across three tabs: (Agent configuration, Application Pings and Advanced). Each tab is described in the following:
Agent Configuration
Section titled “Agent Configuration”The Agent configuration tab contains many options for editing the selected agent configuration group, so the options are grouped into several sections:
Process Report
Section titled “Process Report”-
Enable Process and Dynamic Machine Reports: If selected, collected reports are automatically sent to the PerformanceGuard server.
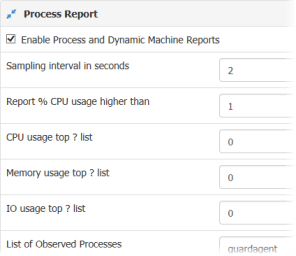
- Sampling interval in seconds: The frequency with which process and system counters are sampled. If you change this, make sure that you enter an integer; you can’t specify a decimal value.
- Report % CPU usage higher than: Only processes with a higher CPU usage than the specified value will be included in the process data report.
- CPU usage top ? list: Only the CPU usage top (entered value) number of processes will be included in the process data report.
- Memory usage top ? list: Specifies how many processes, ordered by amount of memory allocated, that’ll be included in the process data report. If you enter a value of zero (that is no memory allocated), no processes will be selected.
- IO usage top ? list: Specifies how many processes, sorted by amount of memory allocated, that’ll be included in the process data report. If you enter a value of zero (that is no memory allocated), no processes will be selected based on their input/output usage.
- List of Observed Processes: If required, enter the names of executables that you want to make sure that the agent always reports process information about.
- Enable Disk I/O reports: Lets you control whether you want collection of Input/Output data for the system on which the agent is installed. Note that I/O data collection for individual processes will be performed even if you disable this setting.
- Enable Server Performance Counters: If selected, the agent will collect and send statistics about the number of context switches performed on the computer as a whole. The agent will also collect and send Input/Output statistics regarding the network interface card.
What’s a context switch? A context switch is the process of storing and restoring the state of a process so that execution can be resumed from the same point at a later time. Simply put, if a computer has a lot of context switches, it needs to remember a lot of states, and that can affect its performance negatively.
- Enable process based context switch measurement: If selected, the agent will collect and send context switches (see the previous) for individual processes. This setting may be enabled independently of the Enable Server Performance Counters setting (see the previous).
- Utilization Index Interval: If selected, the agent will start measuring the utilization index CPU/Memory/Harddisk/Network parameters if the value is different from zero. The value defines the measuring interval in seconds (the value can’t be lower than the report interval).
Startup and Login Reporting
Section titled “Startup and Login Reporting”These settings play important roles in startup and login time measurement. See also Startup and Login Measurement Facts.
- Enable Startup and Login Reports: Enables reporting on startup and login events.
- Enable Detailed Startup Report: Controls whether a detailed startup report (that is one that includes process details) will be generated.
- Startup Condition: When this condition is met, the operating systems startup measurement is stopped. In other words, you can use this setting to specify exactly when you consider a computer to be started.
- Startup Timeout in seconds: When this number of seconds has elapsed, PerformanceGuard will stop looking for the startup condition. The value also controls the point in time where the detailed startup report is collected.
- Login Start Condition: When this condition is met, the login measurement is started.
- Login End Condition: When this condition is met, the login measurement is stopped.
For details about how to set up the Startup, Login Start and Login End conditions, see Startup/Login Condition Expression SyntaxAgent Configuration Group Settings
Network Report
Section titled “Network Report”- Enable IE Reports: Enables automatic sending of Internet Explorer web page response time reports.
- Enable TCP Reports: Enables automatic sending of TCP response time data reports.
- Enable UDP Reports: Enables automatic sending of UDP data reports.
- Enable Multicast UDP Reports: Enables automatic sending of reports about multicast UDP traffic.
- Enable Advanced TCP Client Socket Reports: Enables automatic sending of TCP client socket data reports.
- Enable Advanced TCP Server Socket Reports: Enables automatic sending of TCP server socket data reports.
- Servers for Advanced TCP: Lets you limit advanced TCP server socket data reports so that they’re only sent for the specified computers.
If we look at the illustration, you’re able to control which of the computers in the gray area that are included in the advanced TCP server socket measurements (click thumbnail to view image in full size):
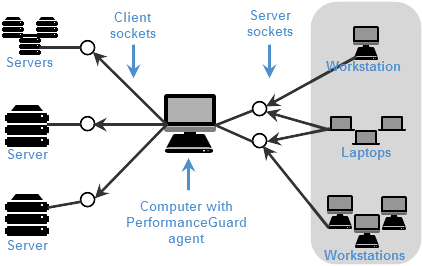
You can specify a single computer, a single named host, all computers in a network, or a combination thereof (separated by commas or spaces).
- Advanced TCP Reports AdvancedTCPStatInterval: Sampling interval—in seconds—for Advanced TCP Activity Overview. That is the frequency with which advanced TCP data are sampled. With this setting you can control the granularity of the collected data.
- Enable Protocol Transaction: Enables agent collection of protocol transaction information. See Protocol Transactions in the Technical Reference section for a description of the concept.See the Technical Reference Manual for a description of the concept. When you enable this, protocol transaction information will be selectable as a type of data to view on the I Want to Know Who Generates IP Traffic.
- Automatically discover local TCP server ports: If you enable this setting, the agent will automatically exclude all local ports from the network report.
- Berkeley Packet Filter Expression: Lets you specify exactly what agents should monitor. You typically use packet filters to tell agents to only monitor packets to and from specific hosts. This way you can limit the scope of your agents, so that they only monitor traffic to and from particular servers. If you don’t use a packet filter, agents will basically monitor any packet. Using a packet filter can thus be an excellent way to avoid collecting unnecessary data. See Berkeley Packet Filter in the Technical Reference section for details about Berkeley packet filter syntax.See the Technical Reference Manual for a description of the concept.
- List of Excluded local TCP ports list: Comma-separated list of local TCP ports that should be excluded from the network report.
- List of Excluded local UDP ports list: Comma-separated list of local UDP ports that should be excluded from the network report.
- List of Included Remote UDP ports list: Comma-separated list of remote UDP ports that should be included in the network report. If the list is empty, all remote UDP ports are included.
- List of Excluded network adapters: Comma-separated list of network adapters that the agent should not connect to. The ability to exclude some network adapters can be useful because some network adapters have incompletely implemented NDIS (Network Driver Interface Specification) layers that can result in unwanted behavior.
Citrix Report
Section titled “Citrix Report”- Enable Citrix Reports: If this setting is enabled, the agent will collect Citrix performance data and send it to PerformanceGuard. This setting has no effect if the configured agent isn’t installed on a Citrix server.
- Sampling interval in seconds: Specifies how often the agent will collect Citrix performance data.
- Allow test of Citrix WFica.ocx If this setting is enabled, PerformanceGuard will test if the Citrix WFIca component can be used to make Citrix login measurements.
User Interface
Section titled “User Interface”These settings control if agent-related options will be available in the operating system taskbar on computers that have the agent installed.
- Enable Task Bar Icon: If this setting is enabled, a small PerformanceGuard agent icon
 (or
(or  in newer agent versions) will be shown in the taskbar notification area (also known as the system tray) of computers with running agents.
- Enable Exit Menu Item: If the agent taskbar icon (see the previous) is enabled, this setting controls if the taskbar icon’s context menu will contain an Exit command. When that’s the case, users can select Exit to hide the taskbar icon. Exit will thus not stop the agent.
- Enable Send Report Menu Item: If the agent taskbar icon (see the previous) is enabled, this setting controls if the taskbar icon’s context menu will contain a Send Report command. When that’s the case, users can select Send Report to force the agent to send collected performance data to PerformanceGuard.
Agent Service Parameters
Section titled “Agent Service Parameters”These settings control the communication capabilities of the agent, including its built-in Telnet server.
- Socket Timeout (ms): This setting controls the timeout used for the communication between the agent and the server. The value must be 5000 or above. If you specify a value less than 5000, a value of 5000 will be used.
-
List of allowed telnet clients: A specification of the hosts and networks that are allowed to access the Telnet server. If the list is blank, the agent won’t start its Telnet server. This list must be a comma-separated list of IP addresses, hostnames and networks. A network is specified as <IP-address>/<net-mask-length>, for example 192.168.1.0/24.
-
Telnet TCP port: The TCP port that the agent’s Telnet server will make itself available on. If this setting is blank, the agent will attempt to run the Telnet service on TCP port 4003.
-
List of allowed web clients: See List of allowed telnet clients in the previous.
-
Web Server TCP port: The TCP port that the agent’s web server will make itself available on. If this parameter is blank, the agent will attempt to run the HTTP service on TCP port 4007.
-
Agent Service Restart Configuration: This setting is used to make the PerformanceGuard Agent service restart automatically. It has the following syntax (BNF):
Terminal window List ::= ([\<Day\>] <Time>*)*Time ::= \<hour\> [':'\<min\>]Hour ::= integerMin ::= integerDay ::= 'sun' | 'mon' | 'tue' | 'wed' | 'thu' | 'fri' | 'sat'All times are local times on the computer that has the agent installed.
Error Handling
Section titled “Error Handling”-
Minimum severity level of error reports that are sent: Lets you prevent irrelevant error reports by specifying a minimum severity level that such reports must contain before they are sent. Errors generated by agents are in the ranges:
- Informational: [0-10]
- Minor error: 128
- Severe error: 129
- Blocking error: 130
- Include details in error reports: If this setting is enabled, complete error information will be included in error reports.
DNS Resolving
Section titled “DNS Resolving”-
Enable DNS resolving on agents
- Enables resolving DNS from network traffic on the agents
-
Only resolve private range IP addresses on agents (10.x.x.x, 172.16.xx-172.31.xx and 192.168.xx).
- Non-private IP addresses will be resolved by the server. The Backend Server uses a reverse lookup of all unresolved ip addresses in the monitored server lists. See Server Lists.
-
Enable reverse lookup for IP addresses not found with forward lookup (When using DNS aliases)
- Allows the agents to find the association between IP and DNS via Forward lookup (A Record) and Reverse lookup (PTR Record)
Custom Counter Templates
Section titled “Custom Counter Templates”If you want your agents to collect data from Windows performance counters, you can create custom counter templates and append them to the agent configuration group. PerformanceGuard even features a small utility that helps you quickly create custom counters with the right syntax. See Custom Counters.
Application Pings
Section titled “Application Pings”If you have defined Apply Application Ping to Agent Configuration (that is traceroutes as well as pings), you can select them on the Application Pings tab. Selected application pings will be appended to the agent configuration and distributed to agents that are members of the agent configuration group in question.
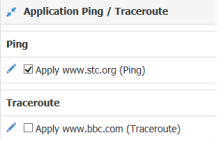
 lets you edit the application ping.
Advanced
Section titled “Advanced”On the Advanced tab you are able to control the periods (also known as keep periods) for which PerformanceGuard will keep different types of agent data, such as:
- Agent process lists
- Individual resource data, that is the local performance metrics and the detailed response time data for each agent
- Performance data for individual processes running on the computer that has an agent installed
- Traffic data for each agent
- Utilization index data for each agent
Values are defined in minutes.
Overlap with General Setup Parameters
Section titled “Overlap with General Setup Parameters”The advanced agent configuration group settings overlap with some of the more Agent Configuration Group Settings (ADMINISTRATION > Setup > Parameters > Status tab). If the value of such a parameter in the agent configuration group settings isn’t the same as on the Status tab, PerformanceGuard will always use the highest value.
These are the parameters that overlap:
| Parameter Name in Agent Configuration Group Settings | Parameter Name on Status Tab | Default Value |
|---|---|---|
| For how long, in minutes, should agent process lists be kept | KEEP_PERIOD_PROCESS_DATA | 10080 minutes (that is one week) |
| For how long, in minutes, should agent resource data be kept | KEEP_PERIOD_DETAIL_DATA | 10080 minutes (that is one week) |
| For how long, in minutes, should agent traffic data be kept | KEEP_PERIOD_TRAFFIC_DETAIL_DATA | 10080 minutes (that is one week) |
| For how long, in minutes, should agent utilization index data be kept | Not available on Status tab, but configurable in frontend server database | 10080 minutes (that is one week) for default agent configuration group 259200 minutes (that is 180 days) for default agent configuration group for servers |
| For how long, in minutes, should agent advanced tcp client counters be kept | Not available on Status tab, but configurable in frontend server database | 10080 minutes (that is one week) |
| For how long, in minutes, should agent protocol transactions be kept | Not available on Status tab, but configurable in frontend server database | 10080 minutes (that is one week) |
| For how long, in minutes, should agent advanced tcp server counters be kept | KEEP_PERIOD_ADVANCED_TCP_DETAIL_ SERVER_DATA | 10080 minutes (that is one week) |
See also Database Retention Periods.