
Performance Counters
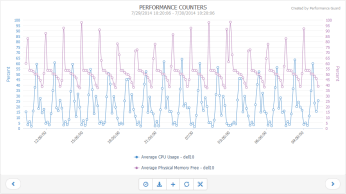
The Performance Counters graph (ANALYZE > Computers > Performance Counters) lets you view details about the current and historical performance of your organization’s computers:
- Standard performance counters, such as CPU usage, startup times and much more
- Details about processes running on the selected computer, by process name as well as by process ID
- Custom Counters, that is data collected by the custom counters that you have yourself set up in PerformanceGuard
The graph is highly dynamic and Interactive Graphs: You can add data from multiple computers, you can mix different types of data (from the Standard Counters, Processes and Custom Counters tabs) on the same graph, you can zoom in on areas of interest, etc. You can view up to five counters on the graph at a time.
Standard Counters
Section titled “Standard Counters”- Start typing to search through all available computer names.

- When you have selected a computer, select the counter (for example cpu-usage) that you want to view on the graph.
- Click the ADD TO CHART button. It may occasionally take a few seconds before the selected counter appears on the graph.
Processes
Section titled “Processes”- Start typing to search through all available computer names.
- When you have selected a computer, select the process (for example System) that you want to know more about.
You can toggle between looking for processes by process name or by a specific process ID if you click the By process name or By process id buttons.
- Select the required counter (for example cpuAvg) that you want to view on the graph.
- Click the ADD TO CHART button. It may occasionally take a few seconds before the selected counter appears on the graph.
Custom Counters
Section titled “Custom Counters”The types of data that you can select on Custom Counters tab are the types of data collected by the custom counters that you have yourself set up in PerformanceGuard; see Custom Counters.
- Start typing to search through all available computer names.
- When you have selected a computer, select the counter (for example IPv4) that you want to know more about.
- Select an instance (if not relevant, the field will simply show _).
- Select a value (for example Datagrams/sec).
- Click the ADD TO CHART button. It may occasionally take a few seconds before the selected counter appears on the graph.