
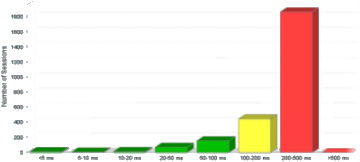
Citrix Sessions Histogram
The Citrix Sessions histogram (ANALYZE > Citrix > Histograms > Sessions) shows the number of Citrix Performance Measurement sessions within time intervals, defined by ICA traffic, latency or session startup time.
-
Select required Citrix server. Then select required Citrix domain and required ICA Clients (either all clients or clients at a particular location or network).
-
In the Primary Type menu, select the data set that you want to cover in the graph.
- ICA traffic (B/s): The sum of outgoing and incoming traffic for this session, measured in bytes per second
- Latency (ms): The average latency for the session, measured in milliseconds.
- Session startup time (ms): The time it took to start the session, measured in milliseconds.
-
The histogram will include a top-x list of users. For example, if you selected Latency in the previous step, the histogram will include a list of the users that experienced the most latency. In the Top X field, select how many users you want such a list to cover, for example a top 10 list.
-
Select the required Interval (that is the period of time that you want to cover). If the predefined intervals don’t suit you, select Custom to Custom Time Periods on Graphs.
-
Click the Update button.