

Get Started with the PerformanceGuard Web Interface

PerformanceGuard monitors how well your organization’s computers, networks and servers work. PerformanceGuard specializes in how IT performance affects users’ ability to work efficiently.
Log in to PerformanceGuard
Section titled “Log in to PerformanceGuard”Open a browser and connect to PerformanceGuard at the address you have received from your PerformanceGuard administrator. Then log in to the PerformanceGuard web interface with the user name and password that you have received from your PerformanceGuard administrator.
What is the PerformanceGuard web interface?
Section titled “What is the PerformanceGuard web interface?”The web interface contains dashboards that provide performance overviews at a glance. When you want to analyze performance, the web interface lets you delve into graphs and tables with very detailed information. When you want to share performance information with your colleagues, the web interface lets you generate reports in standard and custom formats.
Your user role determines what kinds of performance information you can view:
- All users have access to general performance information.
- Users with the Detail role also have access to information about the performance of individual computers.
This access is typically relevant for Service Desk personnel so that they can diagnose performance problems if a user complains. IT managers and analysts typically also use this detailed information in their strategic planning of the organization’s IT infrastructure.
Ask your PerformanceGuard administrator if you’re in doubt about what kinds of information you have access to. Administrators can read about the roles in Manage Users.
Find your way around
Section titled “Find your way around”The main menu of the web interface has these items:
- Home: Your starting page.
- Dashboards: The dashboards that you have access to. See Dashboards and Widgets.
- What’s going on: Near real-time CPU, memory and disk usage for all computers, with drill-down to single computers. See What’s Going On Dashboard.
- Slideshows: Dashboards shown one after the other, for example on a wall monitor. See Dashboard Slideshows.
- Analyze: Graphs, overviews, computer information and Citrix information. The Computers menu is only available if you have the Detail role. See Analyze.
- Reporting: Events, alerts and generated reports.
- Administration: Configuration of PerformanceGuard. This menu is only available to administrators. See Administration.
View performance information
Section titled “View performance information”PerformanceGuard can help you with many typical performance information needs. Note that this list is by no means exhaustive; you have many other options for finding information in PerformanceGuard.
This is what to do when you want to know …
… if a computer has problems
Section titled “… if a computer has problems”You get a call from a user. Her computer is slow — can you fix it, please? The first thing that you want to determine is whether the computer really is slow. If yes, the next thing you want to find out is what slows the computer down.
The Computer Overview dashboard (Dashboards > Computer Overview) has a Computer Event Timeline Widget that makes it easy to determine if a selected computer has had performance problems. If it has, the widget makes it easy to see exactly which problems the computer has had, and exactly when they happened.
The widget looks at events that have happened on the selected computer, and displays them as bubble markers on a timeline. Remember what an event is? It’s a threshold violation, for example a response time that isn’t acceptable. You can zoom in on relevant events and click the bubbles to view details.

… if a problem affects one or multiple computers
Section titled “… if a problem affects one or multiple computers”When a user calls you about a problem, you often need to determine the scale of the problem: Whether the user’s computer is the only one that has the problem, or whether other computers have the same problem.
The Computer Overview dashboard (Dashboards > Computer Overview) tells you just that. When you look up a computer on that dashboard, its Computer and Neighborhood Status Widget compares the performance of the computer with the performance of other computers nearby.
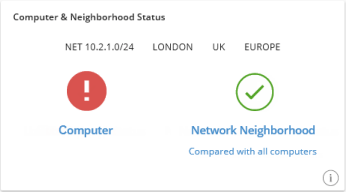
The example shows a problem that only affects a single computer.
… who uses resources
Section titled “… who uses resources”PerformanceGuard helps you identify resource-consuming users and processes in seconds.
Who uses most CPU power and RAM?
Section titled “Who uses most CPU power and RAM?”PerformanceGuard helps you quickly identify your “resource thieves:” processes and users who consume excessive amounts of resources like CPU power and RAM.
- The quick overview: The Processes and Users graph (ANALYZE > Graphs > Combined Bar Charts > Processes & Users) provides the overview in an easy-to-view bar chart format, no matter whether you are looking for resource-consuming users or processes.
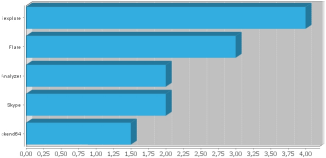
- The details: The Hotspot Overviews hotspot (ANALYZE > Overview > HotSpots > Process Resources) provides detailed data about resource-consuming processes, and you can drill down to view which computers and user accounts ran a given process.
… who generates most IP traffic
Section titled “… who generates most IP traffic”Do you suspect that something is eating up your bandwidth? Or do you want to know if a particular application or location generates a lot of traffic? Would you like to know when traffic occurs? PerformanceGuard provides the answers:
Which applications generate most IP traffic?
Section titled “Which applications generate most IP traffic?”In PerformanceGuard an application consists of a server/port combination, for example server.organization.org on TCP port 80 (HTTP).
The IP Traffic by Application/Location/Process (Time View) graph (ANALYZE > Graphs > Time View > IP Traffic by application) shows which applications generated IP traffic, and when they did it. You can view this data for combinations of all servers and ports, groups of servers and ports, and individual servers and ports.
Which processes generate most IP traffic?
Section titled “Which processes generate most IP traffic?”- The quick overview: The Load Overview (ANALYZE > Overview > IP Traffic > Load Overview) is a pie chart that very quickly lets you find the processes that are responsible for the largest amounts of IP traffic. When you generate the pie chart, try to select Type = Processes and Data type = Load (Sent + Received Bytes).
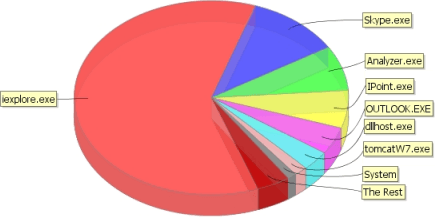
- The details: The Hotspot Overviews hotspot (ANALYZE > Overview > HotSpots > Process Traffic) provides detailed data about traffic-generating processes, and you can drill down to view details about which servers the process communicated with as well as details about which computers and user accounts ran a given process.
- The timing aspect: The IP Traffic by Application/Location/Process (Time View) graph (ANALYZE > Graphs > Time View > IP Traffic by process) is ideal when you want to check if certain processes generate traffic at specific times. You can view this for all servers, for groups of servers, or for individual servers.
Which locations generate most IP traffic?
Section titled “Which locations generate most IP traffic?”The IP Traffic by Application/Location/Process (Time View) graph (ANALYZE > Graphs > Time View > IP Traffic by location) shows which locations generated IP traffic, and when they did it. You can view this for individual servers and ports that the locations have communicated with.
… if some servers are overloaded
Section titled “… if some servers are overloaded”Look at server response times: If many of a server’s responses are slow, it is typically because the server’s hardware is not able to cope with the amount of work that the server has to do.
Do servers respond quickly?
Section titled “Do servers respond quickly?”The Response Time Histogram displays response times for selected servers.
To view the histogram, select ANALYZE > Graphs > Statistics > Histogram.
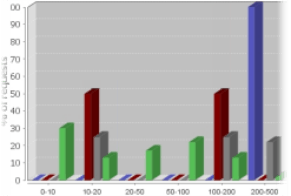
The histogram consists of 10 individual bars: nine response time intervals in milliseconds, and one bar for requests that got no response.
Each bar represents the percentage of replies within a given milliseconds interval.
This way you can very quickly find out if a particular server is potentially overloaded — like the blue one  in the example image.
Can servers handle pressure?
Section titled “Can servers handle pressure?”The Response Times Versus Load graph (ANALYZE > Graphs > Statistics > Response Time Versus Load) can help you uncover otherwise hidden scaling problems.
If response times increase to a non-acceptable level when the number of requests per second increases, it’s very likely the result of an overloaded server getting more requests than it can handle.
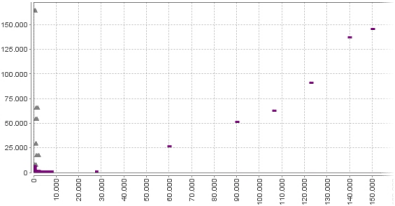
In the example, the gray  server responds quickly no matter how many requests it gets. However, the response times (horizontal axis) of the purple
  server dramatically increase when the server gets many requests (vertical axis)—a typical sign of an overloaded server that could benefit from a hardware upgrade in order to perform better at busy times.
… if web-based applications work efficiently
Section titled “… if web-based applications work efficiently”The PerformanceGuard transaction filters feature is highly useful for monitoring web-based applications.
How long does it take to get responses?
Section titled “How long does it take to get responses?”The Web Activities (Time View) graph (ANALYZE > Graphs > Time View > Transactions) shows you how long it takes for computers on all or individual parts of your organization to get responses when they make web requests. This can help you verify how efficiently users are able to work with web-based applications.
Does a specific element cause trouble?
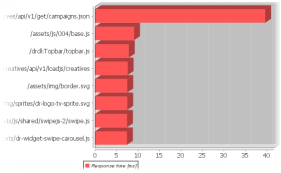
Section titled “Does a specific element cause trouble?”The Compare Web Activities graph (ANALYZE > Graphs > Combined Bar Charts > Compare Transactions) lets you compare the various transactions under a single transaction filter. That way you can, for example, detect if a specific element of a web request takes longer to access than other elements.
In the example, it is evident that one of the elements in the web request takes much longer to access than the other elements.
… if network latency causes trouble
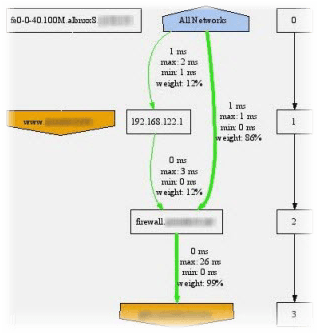
Section titled “… if network latency causes trouble”The View Traceroute Output (ANALYZE > Overview > Trace route > Trace Route Graph) helps you quickly detect any network latency.
A traceroute detects and captures the path that a network packet will travel from a given starting point (a computer that has the PerformanceGuard agent installed) to a specific destination.
While PerformanceGuard detects the route, it will also record the network latency between different routers along the route until reaching the final destination. The results are displayed as an easy-to-understand network map.
The traceroute graph requires that your organization has set up traceroutes. Read more about traceroutes and other similar types measurements in Monitor Availability, Latency and Response Times with Application Ping.
… if performance is good or bad
Section titled “… if performance is good or bad”The answer to this question depends almost entirely on the type of work that you do in your organization. However, there are some rules of thumb, that it makes good sense to follow in almost any type of organization: See I Want to Know if Performance Is Good or Bad.
Frequently asked questions about availability
Section titled “Frequently asked questions about availability”Many PerformanceGuard graphs are able to show the availability of servers, etc., but what is availability?
When you’re ready for more, try out the many different graphs, reports, dashboards, etc. Each of them have matching help, so click the help icon if you need to know more.