
Thresholds on Widgets
Thresholds
Section titled “Thresholds”Display of thresholds is by default on. When you view a graph, you can toggle threshold display off by selecting  Hide thresholds. This can be useful, for example if you think that a threshold blocks your view of the graph’s data points.
Manage Thresholds and Events are only relevant for certain types of data e.g. Response time (ms).
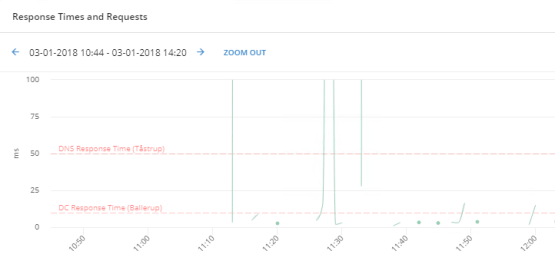
For such data, a threshold i.e. a baseline that the displayed values must ideally be below — can be displayed as a red horizontal line in the graph when:
- Your PerformanceGuard administrator has predefined such thresholds i.e. select ADMINISTRATION > Event Management > Event Rules (or create a new event rule).
- You have selected location, one server group and one agent group. You can also create new location from ADMINISTRATION > Computer Grouping > Locations.
An event is a threshold violation on an individual computer or server e.g. a response time that isn’t acceptable. The event rules define the nature of the triggered event, and the parameters for capturing event-related information in an application. These events are categorized by Severity Levels.
After creating an event rule you can view these threshold lines on the graph. They work as an indicator on the graph providing you with target context and allowing you to identify application when the response time becomes higher or lower than the threshold’s set level. On the graph each threshold has a name with its location, so it is easy for you to see what the threshold is about.
Threshold becomes invisible if you click all the legends to make the series hidden i.e. it will stay visible if there is even one legend visible. If a graph has thresholds, the thresholds will also appear if you use the graph in a report, except when they’re hidden.
You can also enable Adaptive Baselining on this widget, read more about Adaptive Baselining.
Widgets supporting Threshold functionality
Section titled “Widgets supporting Threshold functionality”The following are the widgets that support Threshold functionality:
A threshold for the metric Response Times can be set in Event Management using the Event Rule ‘IP Service - Response Time’
A threshold for the metric Response Times can be set in Event Management using the Event Rules:
- CPU Usage (%) = Computer - Machine Resource Usage
- Memory Usage = Computer - Machine Resource Usage
- Context Switches /s = Computer - Machine Resource Usage
A threshold for the metric Response Times can be set using the Event Rule “Business Transaction - Response Time”.