

View Health KPI Report
KPI (Key Performance Indicator) reports are reports that summarize complex information based on data collected by PerformanceGuard agents.
Health KPI Report—Fixed Business Hours is one such report. The report is intended for IT service delivery reporting to C-level managers (that is top-level managers with “Chief …” titles, such as CEOs, CFOs and CTOs). The report provides a summarized quality assessment of the complete IT service delivery. The term Fixed Business Hours refers to the report’s monitoring interval.
Get the report
Section titled “Get the report”-
In the PerformanceGuard web interface, select REPORTING > Reports.
-
In the Custom Reports list, locate the line containing the Health KPI - Fixed Business Hours report.
-
Do one of the following:
- To download the latest generated version of the report, click the PDF link in the Latest Link column.
- To download older versions of the report (if available), click the link in the Keep for column.
- To generate a new version of the report, click the name of the report, and then continue with the next step.
-
Specify the required parameters:
- Agents: Select which of your organization’s locations you want to include in the report.
- Interval: Select the period of time that the report should cover.
If this is the first time that you generate the report, try to select All agents and last week.
-
Click the PDF button to generate and download the report. Depending on the selected interval and the number of computers at the selected location, it may take a few moments before the report is ready.
Understand the report’s elements
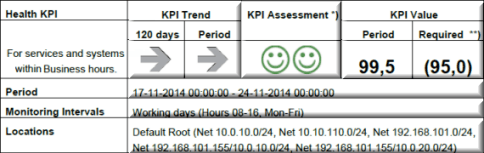
Section titled “Understand the report’s elements”The report is made up of three sections:
- A table that provides a quick KPI summary
- Graphs that show KPI values over time
- A table that provides a KPI summary broken down by location in ascending KPI order
Summary tables
Section titled “Summary tables”The following example shows the elements of the report summary:
Graphs
Section titled “Graphs”The report contains a graph that shows the calculated KPI value over time for the period covered by the report. The red line in the graph represents the required KPI value, and the blue bars represent the actual KPI calculations.
If data is available, the report will also include a graph that shows KPI values for a period that’s longer than the report period. When such data is available, it lets you compare data from the two periods. By default, the longer period is the last 120 days. In this example you are able to compare KPI values from five working days in the current report period (the graph to the right) with KPI values from the last 120 days (the graph to the left):

Set up the report
Section titled “Set up the report”PerformanceGuard administrators can adjust the parameters of KPI reports. See Set Up Health KPI Report and Manage Custom Reports.