
System Status
If you select ADMINISTRATION > Status > System Status, you can view the general health of your PerformanceGuard system through status information about system jobs and resources. A number of system checks are performed every time you access the page.
System Status
Section titled “System Status”This tab shows the status of the PerformanceGuard subsystems.
| Subsystem | Description |
|---|---|
| Database Connection | Tells you whether the PerformanceGuard web interface is able to connect to the database. |
| Database Storage | Overall status of SQL Server file group. You can view more detailed information about this on the Database Storage tab (see the following). |
| Scheduled Jobs | Overall status of scheduled jobs. You can view more detailed information about this on the Scheduled Jobs tab (see the following). |
| Agents Online | Tells you whether any PerformanceGuard agents are currently delivering data to PerformanceGuard. |
| Disk Space | Overall status of local disk space. You can view more detailed information about this on the Disk Space tab (see the following). |
| Log files | Overall status of log files. You can view more detailed information about this on the Log Files tab (see the following). |
| Frontend Servers | Status of your PerformanceGuard solution’s frontend servers. |
| Email Delivery | Status of automated delivery of notifications and reports. |
| Auto joined port spammers found | Indicates whether servers with Join Server Ports to Get Targeted Information have been detected. |
| Status | Description |
|---|---|
| OK | The subsystem is working correctly. |
| NA | Status for the subsystem isn’t available. |
| WARNING | The subsystem is either close to a FAILURE, or the execution time of a task is getting close to a time limit. |
| FAILURE | The subsystem isn’t working correctly. Either the subsystem itself has failed, or the subsystem has failed to complete its task within a required time limit. |
The time limit used for evaluating WARNING and FAILURE is set differently on the individual subsystems.
Frontend Servers
Section titled “Frontend Servers”This tab shows the status of your PerformanceGuard solution’s frontend servers: Whether they are online, the PerformanceGuard version they are running, the number of PerformanceGuard agents that report to them, and more. Click the name of a request to view details.
For more information about frontend servers, their priorities, etc., see also Manage Frontend Servers.
Scheduled Jobs
Section titled “Scheduled Jobs”PerformanceGuard runs a number of batch jobs in the background. Most of those jobs Aggregation of Data and delete old performance data, but there are also jobs that generate alerts, calculate KPI (Key Performance Indicator) and SLA (Service Level Agreement) values, etc. Some of the jobs are SQL Server jobs scheduled by the SQL Server Agent.
Examples of scheduled jobs:
- Citrix Data Aggregation
- SLA Calculation
On the Scheduled Jobs tab you can view information about each scheduled job, including the job interval (that is how often the job is supposed to run) and when it last ran. You can also view the status of each job. The status is based on the following criteria:
| Status | Description |
|---|---|
| OK | The job completed successfully no more than two job intervals ago. Example: With a job interval of 60 seconds status will be OK if the last occurrence of the job took 2 minutes or less to complete, and completion took place no more than two job intervals ago. |
| WARNING | The job took more than 2 × the job interval to complete. Example: With a job interval of 60 seconds status will change to WARNING if the last occurrence of the job took more than 2 minutes to complete. |
| FAILURE | The job went wrong and didn’t complete. Alternatively, the job completed, but it took more than 10 × the job interval to complete, or more than 5 × the job interval since the job last completed. Example: With a job interval of 60 seconds status will change to FAILURE if the last occurrence of the job took more than 10 minutes to complete (or more than 5 minutes since the job last completed). |
| NA | The job has no status, because it hasn’t run yet. |
Database Storage
Section titled “Database Storage”This tab shows the total and available disk space for each file group in the PerformanceGuard SQL Server database.
If available disk space is less than 5%, the System Status tab (see the previous) will report a WARNING status for the Database Storage subsystem. If available disk space is less than 1%, the status will be FAILURE.
Disk Space
Section titled “Disk Space”The disk space tab shows the available disk space on the server on which the PerformanceGuard Web Server service runs.
For each physical drive the total and available disk space is listed. If available disk space is less than 5%, status of the drive will be WARNING. If available disk space is less than 2%, status of the drive will be FAILURE.
Log Files
Section titled “Log Files”You can view these PerformanceGuard log files in the PerformanceGuard web interface:
- Backend server log files
- Frontend server log files (provided the frontend server runs on the same server as the PerformanceGuard web interface).
- PerformanceGuard web interface log files
- Access log files (that is logging of who has accessed the PerformanceGuard web interface)
You can view the size of each log in kilobytes (KB). A log size of 0 B means that the log is empty. You can also view the growth rate of each log, that is how much the log has grown per hour.
Monitor Log Growth Rates
Section titled “Monitor Log Growth Rates”PerformanceGuard can monitor log file growth and report a WARNING or FAILURE status if the log file growth rate is higher than a specified value.
To specify which log file folders you want to monitor, select ADMINISTRATION > Setup > Parameters, select the Display tab, scroll down to the Directories section, and specify the path to the required log file folders in the Monitor Log Folders field.
If you want to specify multiple folders, use a comma to separate the paths.
Email Delivery
Section titled “Email Delivery”On this tab you can view information about any Manage Custom Reports e-mails that are waiting to be sent.
If the tab shows that status is not OK, it is typically due to problems with the Manage SMTP Notification Service that PerformanceGuard uses. You can check the PerformanceGuard mail server configuration by selecting ADMINISTRATION > Setup > SMTP. If the PerformanceGuard mail server configuration is correct, contact the administrator of the mail server for information about the status of the mail server.
Delete Data
Section titled “Delete Data”This tab provides detailed information about deletion jobs, including how long data is stored in each table in the database. If a scheduled deletion jobs fails, this information lets you identify which database table is causing the problem.
| Column | Description |
|---|---|
| Label | A unique label name for each delete action. |
| Table | The name of the database table that data is deleted from. |
| Parameter | The name of the parameter in the STATUS table that controls how long data is kept in the database. |
| Elapsed (s) | The time that it took to execute the last successfully completed delete action. |
| Delete point | The next time stamp to delete. This should be the time stamp of the oldest data in the table. |
DB History
Section titled “DB History”On this tab you can view the backend database version history with time stamp and version information for each upgrade. The database is typically upgraded when you Upgrade Versions Between 6.1.27 and 6.3.104 to Latest Version your PerformanceGuard solution by installing a new version.
- The Status column can indicate either started (ongoing upgrade), applied (successful upgrade) or failed.
- In the Rollup column, Yes indicates that the upgrade version includes previous versions so that it’s possible to subsequently apply a previous version if required.
- The Message column is typically empty, but may contain problem-finding information about failed upgrades.
Automatically Poll System Status from External System
Section titled “Automatically Poll System Status from External System”It’s possible to poll the status of your PerformanceGuard system from another system. This way you can automatically monitor the status of your PerformanceGuard system.
It works like this: By requesting certain URLs from a standard HTTP client, you’ll receive a simple JSON plain text version of the PerformanceGuard system’s status.
All URLs require basic authentication using standard PerformanceGuard user credentials.
Status values can be either OK, NA (that is status not available), WARNING or FAILURE. Your automatic monitoring job should request the system status page and check for the words WARNING or FAILURE.
Here we have used a Chrome browser to ask for the overall PerformanceGuard system status by requesting …/rest/system/status:

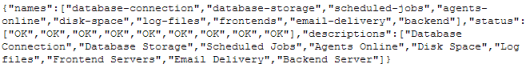
Here we have asked for the status of each subsystem by requesting …/rest/system/status/subsystems:
Here we have asked for frontend server status by requesting …/rest/system/frontends:

It’s the PerformanceGuard Web Server service that provides the data that you can poll. If the service uses the default ports 80 and 81, you don’t need to specify a port number in your request, but if the service uses a different port number, you must specify that port number in your request.