

Tools on Graphs and Widgets
Graph widgets, such as the Application Chart, Computer Chart, AutoSteps Chart and Latency Chart widgets, have a toolbar with tools that change how the data on the graph is shown. Not all tools are available on all widgets.


Split by server or process
Section titled “Split by server or process”The Application Chart widget by default shows one graph per application. However, one application may run on several different servers, so it can be useful to see if all of those servers perform equally well.
To see this, click the widget’s Split by icon  , and then select one of these options:
- Server: one graph per server that runs the application.
- Process: one graph per process that uses the application.
- None: one graph per application. This is the default.
For web activities, splitting shows one graph per web activity element that PerformanceGuard measures.
Connect points
Section titled “Connect points”By default, the graph connects the points automatically (Automatically connect points)  . If you don’t want this, you can select Connect all points
  or Disconnect all points
  .
.
Resolution
Section titled “Resolution”To sort the large data-sets and view them more clearly in the graph, click the widget’s Resolution icon  .
.
You can use resolution when you have a large number of individual graphic elements that you can not distinguish between them. It is very similar to the idea of putting data into categories / class as it divides the data values into a set of disjoint intervals called Bins. It will allow you to group individual data values into one instance of graphic element.
The data values which fall in to those selected respective intervals, a bin, are replaced by a value representative of that interval. The data outside of the [start, end] range is discarded and thus will not be displayed on the graph.
Toggle Minimum and Maximum Values Off and On
Section titled “Toggle Minimum and Maximum Values Off and On”The widget by default shows average, minimum and maximum values. To toggle the minimum and maximum values off and on, click the widget’s Show minimum-maximum / Hide minimum-maximum icon  .
.
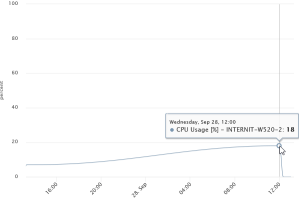
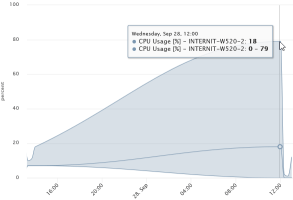
When you view minimum and maximum values, you can reveal otherwise hidden peaks in resource usage.
The difference can be dramatic. Look at this example: When we view average values, the highest average value is 18, but when we view the minimum and maximum values, the maximum value for the same period turns out to be 79.
Adjust Vertical Axis (Y-Axis)
Section titled “Adjust Vertical Axis (Y-Axis)”To adjust the vertical axis of a graph, click the widget’s Adjust y-axis icon  . If the graph has multiple vertical axes, you can adjust each axis separately. Click Reset all to return to the default axes.
Statistics
Section titled “Statistics”When you view the graph, you can also see a Statistics table by clicking Statistics  . Click Graph to return to the graph. Statistics icon will not be visible if there is no data available.
To zoom in, click and drag across the required area of the timeline. When you have zoomed in, the toolbar shows the zoomed period. Use the arrows next to the period to move back and forth in time, and click Zoom out to return to the full period.
Thresholds
Section titled “Thresholds”Display of thresholds is by default on. When you view a graph, you can toggle threshold display off by selecting  Hide threshold. This can be useful, for example if you think that a threshold blocks your view of the graph’s data points.
Manage Thresholds and Events are only relevant for certain types of data e.g. Response time (ms).
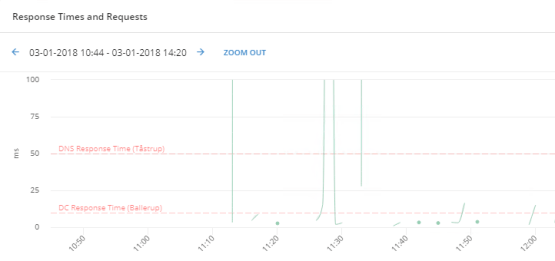 For such data, a threshold i.e. a baseline that the displayed values must ideally be below — can be displayed as a red horizontal line in the graph when:
- Your PerformanceGuard administrator has predefined such thresholds i.e. select Administration → Event management → Event rules (or create a new event rule).
- You have selected location, one server group and one agent group. You can also create new location from Administration → Computer grouping → Locations.
An event is a threshold violation on an individual computer or server e.g. a response time that isn’t acceptable. The event rules define the nature of the triggered event, and the parameters for capturing event-related information in an application. These events are categorized by Severity Levels.
After creating an event rule you can view these threshold lines on the graph. They work as an indicator on the graph providing you with target context and allowing you to identify application when the response time becomes higher or lower than the threshold’s set level. On the graph each threshold has a name with its location, so it is easy for you to see what the threshold is about.
Threshold becomes invisible if you click all the legends to make the series hidden i.e. it will stay visible if there is even one legend visible. If a graph has thresholds, the thresholds will also appear if you use the graph in a report, except when they’re hidden.
You can also enable Adaptive Baselining on this widget, read more about Adaptive Baselining.
Widgets supporting threshold functionality
Section titled “Widgets supporting threshold functionality”The following are the widgets that support threshold functionality:
A threshold for the metric Response Times can be set in Event Management using the Event Rule ‘IP Service - Response Time’
A threshold for the metric Response Times can be set in Event Management using the Event Rules:
- CPU Usage (%) = Computer - Machine Resource Usage
- Memory Usage = Computer - Machine Resource Usage
- Context Switches /s = Computer - Machine Resource Usage
A threshold for the metric Response Times can be set using the Event Rule “Business Transaction - Response Time”.
Export to Excel
Section titled “Export to Excel”Many widgets, including graph widgets, tables and lists such as the Event HotSpot Widget, have an Export to Excel button  . Click it to download the widget’s data as an Excel file (.xlsx).
Exporting data is useful when you want to analyze the data more closely, in other ways, or share it with others.