
Interactive Graphs
Some of the PerformanceGuard graphs, such as the TCP Counters and the Performance Counters, are highly interactive.
When you have added data to a graph like the TCP Counters graph or the Performance Counters graph, you can quickly and intuitively zoom in on areas of interest, change time span, add the graph to reports, and much more.
View Data Point Details
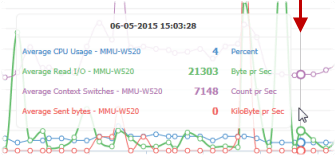
Section titled “View Data Point Details”To view details about a specific data point in the graph, place your mouse pointer over the data point.
If your graph contains many data points, the data points may overlap and be difficult to make out. For this reason PerformanceGuard automatically draws a thin guideline that helps you easily view details about each individual data point in the graph.
To zoom in on an area of interest in the graph, drag your mouse pointer over the area of interest. You can zoom in as many times as you require.
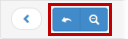
When you have zoomed in on an area, two buttons appear in the bar below the graph: one that lets you undo the last zoom, and one that lets you reset your zoom level:
Time Settings
Section titled “Time Settings”Provided data is available you can view data from points in time before and after your current view. You can also change the graph’s time span so that it covers a different interval than the default 24 hours.
Move Forward and Back in Time
Section titled “Move Forward and Back in Time”You can navigate forward or back in time relative to the graph’s initial time span if you click the left (back in time) and right (forward in time) arrows in the bar below the graph:
Change Time Span
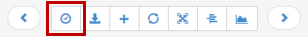
Section titled “Change Time Span”You can change the graph’s time span if you click the clock button in the bar below the graph:
This lets you select between a number of predefined time spans (such as the last 30 minutes). If the predefined time spans don’t suit you, you can define your own custom time span based on an interactive calendar.
Remember to click the SAVE button when you have selected or defined a time span.
Update Graph Content
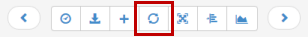
Section titled “Update Graph Content”New data may become available while you view the graph. To update the content of the graph, click the update button in the bar below the graph:
Change Way that Graph Shows Content
Section titled “Change Way that Graph Shows Content”There are several ways in which you can change the way that the graph shows data:
Make Graph Larger
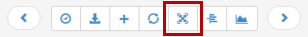
Section titled “Make Graph Larger”To enlarge the graph so that it becomes as large as the window in which you view it, click the toggle chart size button in the bar below the graph:
To return to normal size, simply click the button again. Alternatively, press ESC on your keyboard.
Remove Unwanted Data
Section titled “Remove Unwanted Data”To remove unwanted data from the graph, click the remove icon  next to the legend that represents the data that you no longer want to view
Hide Data
Section titled “Hide Data”You can toggle the show of individual data off and on: Click the legend that represents the data that you want to hide, and then click the HIDE SERIES button.
When the data is hidden, its legend becomes gray. To show the data on again, click the legend and then click the SHOW SERIES button.
Change Y-Axis
Section titled “Change Y-Axis”You can change the Y-axis (vertical axis) interval for individual data as well as for all data on your graph:
Individual Data
Section titled “Individual Data”- Click the legend that represents the required data, and then click the CHANGE Y-MIN AND Y-MAX button.
- Specify required minimum and maximum values (both are required).
- Click the SET button.
To reset a changed Y-axis interval to its default values, click the legend that represents the required data, and then click the UNSET Y-MIN AND Y-MAX button.
All Data on Graph
Section titled “All Data on Graph”When you want to compare the performance counters on your graph, it sometimes makes sense to use the same Y-axis range for all the counters:
- Click the customize y-axis button in the bar below the graph:
- Specify required minimum and maximum values (both are required).
- Click the SET button.
To reset the y-axis to its default value, click the customize y-axis button again and then click the RESET button.
Remove Lines that Connect Points
Section titled “Remove Lines that Connect Points”Data points are by default connected by lines. If required, you can remove the connecting lines for individual data: Click the legend that represents the required data, and then click the DO NOT CONNECT POINTS button.
Connected points
Disconnected points
To connect points again, click the legend that represents the required data, and then click the CONNECT POINTS button.
Show Peaks, Minimums and Maximums
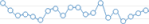
Section titled “Show Peaks, Minimums and Maximums”The graph by default shows average data. If you also want to view peaks, minimums and maximums, you can easily toggle that on and off for individual data as well as for all data on your graph.
Without and with peak data
Individual Data
Section titled “Individual Data”- Click the legend that represents the required data.
- Click the ENABLE Average TO Peak AREA SERIES button.
To remove the peak data, click the legend that represents the required data, and then click the DISABLE Average/Low TO Peak AREA SERIES button (again the button may have another name depending on the data).
All Data on Graph
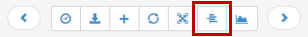
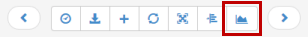
Section titled “All Data on Graph”To toggle peaks, etc. on and off for all data on your graph, click the toggle area chart button in the bar below the graph:
Use Graph Elsewhere
Section titled “Use Graph Elsewhere”If you want to quickly share the graph with colleagues, or include it a report to top management, customers or similar, you can easily do so:
Export Graph
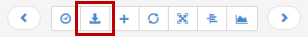
Section titled “Export Graph”To quickly export the graph in .png or .pdf format, click the download button in the bar below the graph:
Add Graph to Report
Section titled “Add Graph to Report”You can quickly add the graph to an existing or new PerformanceGuard report:
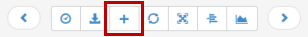
- Click the plus button in the bar below the graph:
- Select the required report.
- Specify a Header (required) and a Description (optional).
- Click the ADD TO REPORT button.