
Application Status Widget
The purpose of Application Status Widget is to display the status of an application that is based on the number of current events.
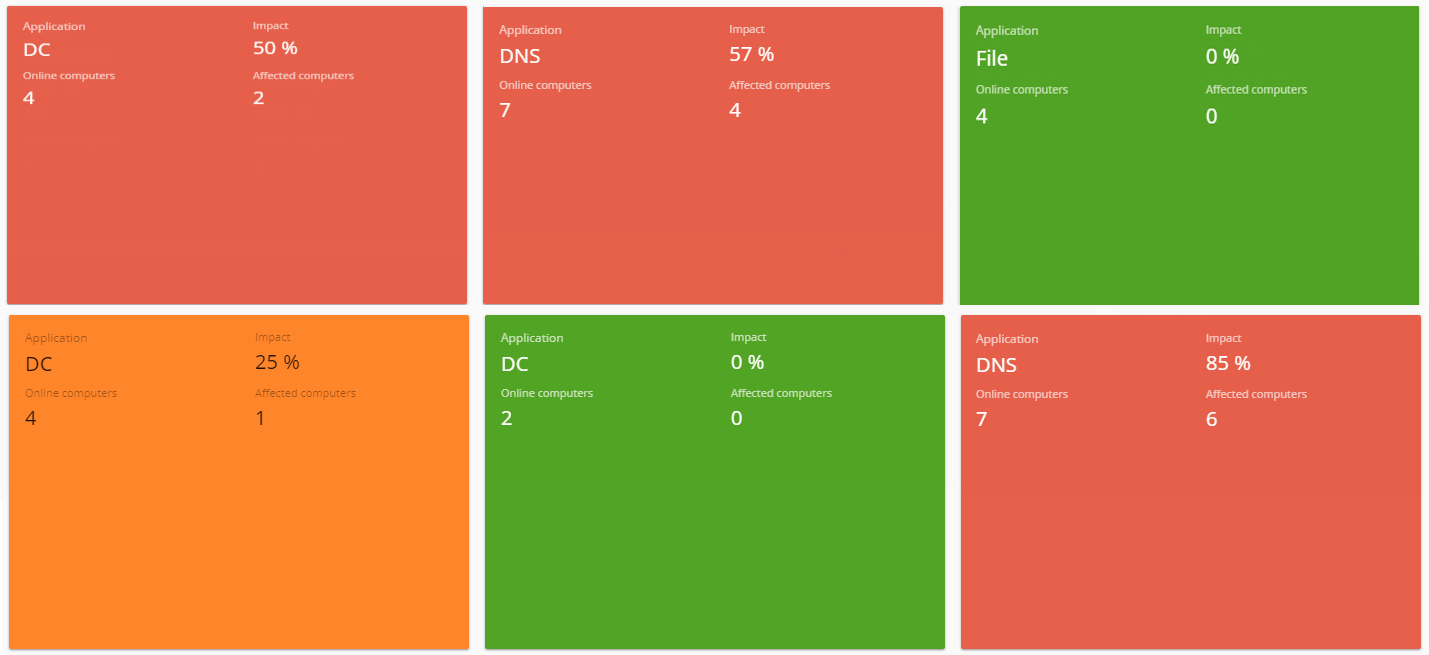
It presents all the affected and online computers at selected location within the selected time period. The user is able to see how big the affected impact is and how many applications are affected with that impact.
The widget can show this information about any application - including web-based activities that your PerformanceGuard administrator has defined.
The widget allows user to identify the number of computers that have accessed a specific application as well as the number of computers affected by events such as response time or availability.
The Impact Ratio is the % of the online computers that are affected by degraded performance on the application. The application status is color based on the following:
- Green: Less than 10% of the online computers are affected
Yellow: 10 - <20% of the online computers are affected- Orange: 20 - <30% of the online computers are affected
- Red: 30% or more of the online computers are affected
Set Up the Widget
Section titled “Set Up the Widget”You have to Network Applications before you can set up the widget. PerformanceGuard automatically creates an Application Online event when an application has been created.
Technically, your administrator sets up PerformanceGuard applications to define this.
-
Your PerformanceGuard administrator has predefined Event rules i.e. select ADMINISTRATION > Event Management > Event Rules (or create a new Manage Thresholds and Events).
-
For Client/Server applications:
- Response Time, Availability and Application Online
-
For Web applications:
- Response Time, Availability and Application Online
-
How does PerformanceGuard determine if a computer is affected or not? PerformanceGuard looks at the performance data it receives from agents installed on your organization’s computers. It continuously evaluates the number of computers affected by events over a period.
PerformanceGuard comes with a number of built-in event rules, so your administrator doesn’t necessarily have to set up event rules of his own.
Select what You Want to View
Section titled “Select what You Want to View”Your PerformanceGuard administrator has typically set up the widget to view the application status.
When that’s the case, you can simply use the Applications menus in the top part of the dashboard to view the application status for selected Time Period.
You can also have location displayed in the widget, simply check  .
.