
AutoSteps Job Heat Map Widget
Formerly known as AutoSteps Status
The AutoSteps Job Heat Map Widget monitors the conditions of the Scripts executed by AutoSteps. The widget together with the Autosteps Chart Widgetwidget gives you an overview with a matrix stating the latest execution of the scripts as well as showing history in the graph. The AutoSteps Status widget provides overall status information for the jobs handled by AutoSteps as well as status information of individual jobs.
AutoSteps works by issuing automated, simulated transactions from a script client to your application. These testing scripts become “monitoring” tools by running at regular intervals providing you with a baseline. For more information view About AutoSteps.
AutoSteps will keep running, discover the error, alert you and provide detailed information about the problem where real user monitoring will not be able to comprehensively test for the functional correctness.
Alongside these scripted measurements AutoSteps will also keep track of how the scheduled jobs are doing. This information is what is presented in this widget.
Set up the Widget
Section titled “Set up the Widget”You simply need to add the widget to the dashboard by adding the required information in the widget setup dialog’s menu.
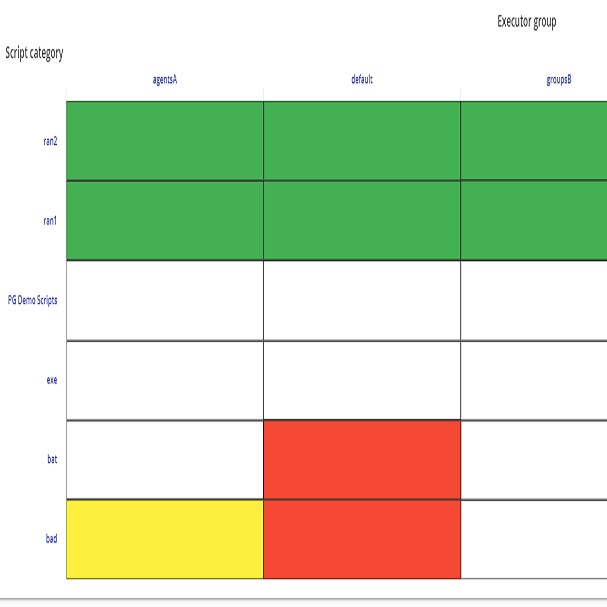
AutoSteps Status Matrix
Section titled “AutoSteps Status Matrix”AutoSteps Status matrix displays Create a Script and Create an Executor Group.
Y-Axis
Section titled “Y-Axis”The Y-axis displays Create a Script i.e. a list of scripts grouped by their respective categories.
The Scripts are a combination of a Script file, information about what program is to be used to execute the script and a set of execution parameters. Scripts are part of the definition of a Job together with Schedules and Executor Groups.
X-Axis
Section titled “X-Axis”The X-axis displays Create an Executor Group i.e. a list of executor agents grouped by their respective executor groups.
The Executor groups are part of the definition of a Job together with Scripts and Schedules.
The execution for scheduled jobs will be displayed on the AutoSteps status widget in different colors depending on their status i.e. red, green, yellow and white e.g. if a job failed it will be displayed as red. However, it will not provide you with enough information to diagnose what exactly failed and why.
Read more in AutoSteps User Interface.
Select what you Want to View
Section titled “Select what you Want to View”The widget displays an Overview of Script Category and Executor Groups on your dashboard. How to create these Script Category and Executor Groups, see AutoSteps User Interface.
- Simply click on a category listed under Script Category or a group listed under Executor Group that you want to view on your dashboard to see the individual job results within those category and groups. Click
 to come back to the default view.
 - Hovering over the Scripts will give you the exact time and date of the last execution of the Scripts.
AutoSteps Widget
Section titled “AutoSteps Widget”The widget together with the Autosteps Chart Widget gives you an overview with a matrix stating the latest execution of the scripts as well as showing history in the graph. You can measure a number of metrics such as response times, availability and requests from a number of different Executors.
For a detailed analysis of AutoSteps widget data with AutoSteps widget view Autosteps Chart Widget.
The two widgets together provides a great flexibility and allows you to retrieve data specific to their needs by creating/adding customs scripts.
AutoSteps can be run as frequently as needed, every few minutes if necessary allowing you to monitor availability and end-to-end performance 24/7.
History
Section titled “History”The history functionality in the AutoSteps Status widget allows you to monitor the status of the scripts executions.
The navigation in the status tab reflects what you can view in the History e.g. if you have script category expanded and not the executor groups then in history you can view each individual script’s status but not an individual executor. Updating the time period (zooming) also affects the status and history of the widget as well.
You can view the history by two modes:
History by Executor Groups
Section titled “History by Executor Groups”This mode allows you to view the history by the default or by executor groups i.e. which ever view has been selected in the Status. It allows the user to identify the exact time in that executor group in which the problem has occurred which caused an unsuccessful execution.
History by Script Categories
Section titled “History by Script Categories”This mode allows you to view the history by scripts or script categories i.e. which ever view has been selected in the Status. It allows the user to identify the exact time in that particular script in which the problem has occurred.
The history bubbles have two indicator colors: