
Load Overview
The Load Overview chart (ANALYZE > Overview > IP Traffic > Load Overview) presents an overview of communication to servers, ports and applications as well as from subnets and Citrix servers. It also lets you quickly identify the most used processes.
- Type: Determines the type of information shown on the pie chart:
- Servers: Lists servers accessed by computers.
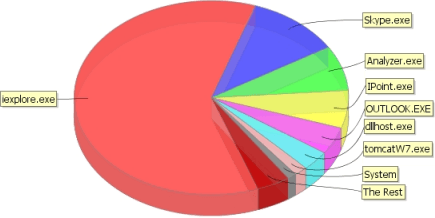
- Processes: Lists processes used by computers.
-
- Ports: Lists ports accessed by computers.
- Services: Lists server:port combinations accessed by computers.
- Subnets (outgoing traffic): List client subnets that have accessed servers.
- Citrix Servers (outgoing traffic): List Citrix servers that have accessed servers.
-
Show top # only: By default only the top 20 entities are shown, but you can change this if required. Note that the last 5 % is always grouped together as a single pie slice named The Rest.
-
Agents: Filter on computers. Select a specific group of computers or All agents.
-
Servers: Filter on servers. Select All Servers, All Monitored Servers or a specific server or server group.
-
Data Type: Determines the type of data by which the pie chart is ordered. The option Unavailability means the number of requests that didn’t receive a response.
-
Interval: Select which time interval the pie chart should be based on. If the predefined intervals don’t suit you, select Custom to Custom Time Periods on Graphs.
- Advanced Mode: Check this to show the Exclude top field.
- Exclude top: Exclude the top n items from the pie chart. This can be useful if the first item covers nearly 100% of the chart.