
Response Time Histogram
The Response Time Histogram displays response times for selected servers.
To view the histogram, select ANALYZE > Graphs > Statistics > Histogram.
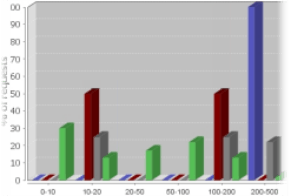
The histogram consists of 10 individual bars.
Each bar represents the percentage of replies within a given milliseconds interval.
This way you can very quickly find out if a particular server is potentially overloaded—like the blue one  in the example image.
- Servers: Select which servers or server groups you want to base your histogram on. Server groups are enclosed in <>. You can only select server groups and monitored servers. See Server Lists for details about monitored servers.
- Agents: Select the group of computers you want to base your histogram on. Super groups, that is groups of groups, are enclosed in <>.
- Interval: Select the period of time that the graph should cover. If the predefined intervals don’t suit you, select Custom to Custom Time Periods on Graphs.
- Ports: Select which port or port group you want to base your histogram on. Port groups are enclosed in <>. You can only select port groups and monitored ports. See Port Lists for details about monitored ports.