
Compare Web Activities
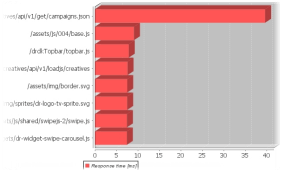
With the Compare Transaction bar chart (ANALYZE > Graphs > Combined Bar Charts > Compare Transactions) you can view the performance of multiple web activities based on a Web Applications.
- Transaction filter: List of defined transaction filters that contain data.
- Server & Port: Select required server and port combination.
- X-axis Min and Max: Enter the required range for the bar chart’s horizontal axis. If you leave the fields empty, the range will automatically reflect the minimum and maximum values found in the data.
- Type: Determines which type of data the bar chart will contain. You can view descriptions of the available types in Graph Terms and Definitions.
- Agents: Select the group of computers that the bar chart should be based on. Super groups, that is groups of groups, are enclosed in <>.
- Interval: Select the period of time that the graph should cover. If the predefined intervals don’t suit you, select Custom to Custom Time Periods on Graphs.
- Transaction: Select one or more transaction tags from the selected transaction filter. To select multiple tags, press CTRL on your keyboard while you select.