

Elevation Analytics
The Privileges page (Windows → Privileges) gives you a continuous audit trail of elevation activity across your fleet. Use it to understand how often users request elevated access, which applications are being elevated, and whether those requests are being approved or rejected — all without touching individual endpoints.
Time range and filters
Section titled “Time range and filters”All tabs share a single time range selector at the top: Today, 3D (3 days), 7D, 1M, and 3M.
Changing the time range updates every chart simultaneously, so you can compare a single day against the past month.
Use the filter next to the time range selector to narrow all charts to an Application, a User Name, or an Endpoint Name.
Summary
Section titled “Summary”The Summary tab is the starting point — it answers the question “how much elevation activity is happening?”
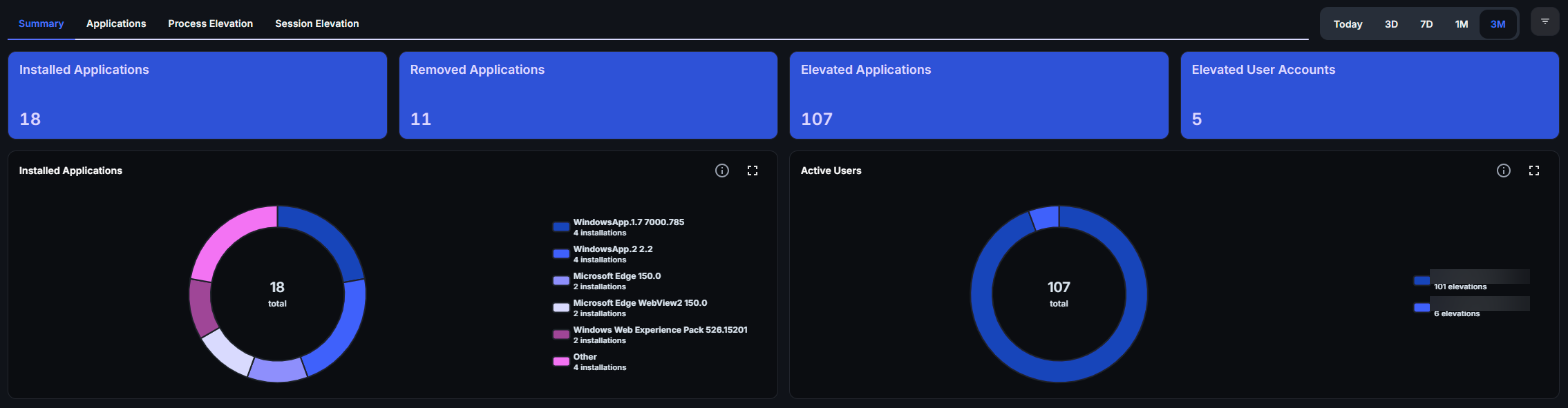
Four count cards show the totals for the selected period:
- Installed Applications — software installed through a privilege elevation
- Removed Applications — software removed through a privilege elevation
- Elevated Applications — the number of distinct applications that were elevated
- Elevated User Accounts — the number of distinct users who requested elevation
Select a card to open its chart. Below the cards, the Installed Applications and Active Users pie charts show which applications were installed and which users elevated most.
If these numbers are unexpectedly high, or growing over time, that is a signal to review whether your elevation policies are scoped correctly.
Applications tab
Section titled “Applications tab”The Applications tab shows install and remove events that happened via elevation. It is useful for answering “what software is being installed or removed by users who needed elevated rights?”
If you see unexpected applications being installed through elevation, check whether those applications should be deployed centrally through Application Manager instead of relying on individual user elevation requests.
Process Elevation tab
Section titled “Process Elevation tab”Process elevation is the more granular of the two elevation types — a user runs a single executable with admin rights rather than gaining a full admin session. This tab answers “which applications are being elevated, by whom, and are those requests being allowed?”
The Elevated Applications chart shows which executables are elevated most frequently. High counts for unexpected applications may indicate users working around policy restrictions.
The Elevated User Accounts chart breaks down elevation requests per user into Approved Elevations and Rejected Elevations. A user with many rejected elevations is repeatedly trying to run something that policy does not allow — that is worth investigating. An application that users elevate often is a candidate for its own process elevation rule, so you control exactly where it may run from and which child processes it may start.
The Elevation Overview chart shows elevated users and the applications they requested over time.
Session Elevation tab
Section titled “Session Elevation tab”Session elevation gives a user temporary administrator rights for their entire session, not just a single process. It is broader and less restrictive than process elevation.
The Elevated User Accounts chart here shows the same Approved/Rejected breakdown, but scoped to session elevation requests. Because session elevation is more powerful, rejected session elevation requests deserve closer attention than rejected process elevation requests.
Good to know
Section titled “Good to know”- Process vs. Session elevation — Process elevation is scoped to a single executable and is the preferred approach for most use cases. Session elevation is broader and should be granted only where process elevation is not practical. Both types are configured under Windows → Configurations → Privileges.
- Rejected elevations are not failures — they are the policy working correctly. But a pattern of repeated rejections for the same user or application suggests the policy may need adjustment.
- Empty charts are expected in environments with low elevation activity or strict process elevation rules that prevent most requests from reaching the approval stage.
- Elevation analytics complement configuration — use these charts to validate that your elevation configuration is behaving as intended, then tune the rules based on what you observe.