

Windows Dashboard
The Windows Dashboard (Windows → Dashboard) is the first place to look when you want a quick read on the health of your Windows fleet. It brings together endpoint status, application patching, driver compliance, reliability, and privilege activity into a single view — without having to navigate each section individually.
All charts on the dashboard are interactive: clicking a segment takes you to the relevant filtered list.
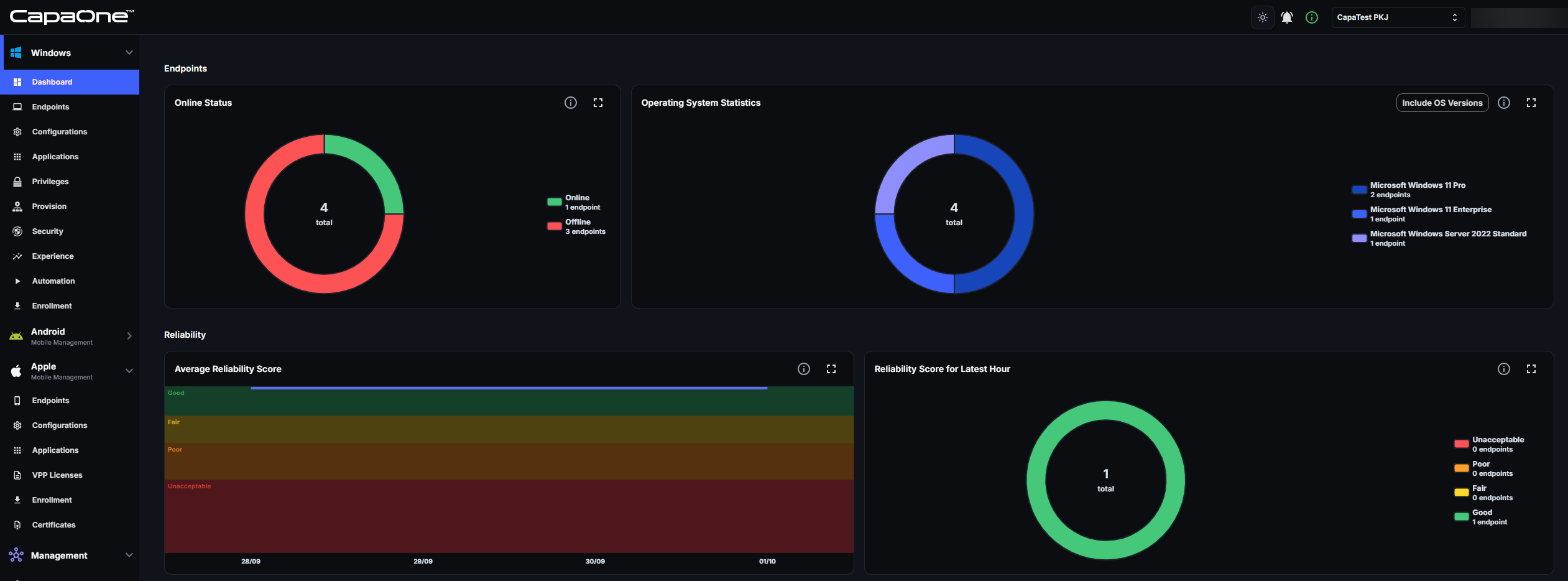
Endpoints — online status
Section titled “Endpoints — online status”The Online Status widget shows how many of your Windows endpoints are currently connected to CapaOne versus offline. An endpoint is considered online if it has checked in recently.
With Application Manager or Provision Manager, the Endpoint Progress widget next to it shows the installations and updates that are queued or running. See Operations in Progress.
A spike in offline devices can indicate a network issue, a failed agent update, or devices that have been powered off. Click the offline segment to see which specific endpoints are affected.
Operating System breakdown
Section titled “Operating System breakdown”The OS statistics widget shows which Windows editions and versions are in use across your fleet. Use the Include OS Versions toggle to switch between a simple edition view (e.g., Windows 11 Pro vs Enterprise) and a version-level breakdown (e.g., Windows 11 23H2 vs 24H2).
This is useful for identifying devices that have not received a feature update and may be falling behind on OS-level security patches.
Reliability
Section titled “Reliability”The reliability widgets show the Average Reliability Score as a trend line over time, and the Reliability Score for Latest Hour. This section requires Experience Monitor. The score reflects how stable endpoints are — frequent crashes, application failures, and hardware errors push the score down. Ratings range from Unacceptable through Poor and Fair to Good.
Click the Reliability link in the widget header to open the full Reliability view with per-device detail and event logs.
Privilege elevations
Section titled “Privilege elevations”The Elevation Overview widget shows a snapshot of privilege activity — how many elevations occurred in the recent period. The Installed Applications chart next to it shows which software was installed through a privilege elevation. This section requires Privilege Manager.
If you see unexpected activity here, open Elevation Analytics to investigate further.
Repository Apps — updates available
Section titled “Repository Apps — updates available”This widget shows which Repository Apps have outstanding updates and how many endpoints are affected per application. It is a quick indicator of patch debt: a large number of pending updates means endpoints are running outdated software.
Click any segment to navigate to the relevant Application Manager entry.
Software and driver compliance
Section titled “Software and driver compliance”Additional widgets cover the broader compliance picture:
- Software Status — the proportion of endpoints that are fully up to date, outdated, or have no software assigned.
- Driver Compliance — the proportion of endpoints with up-to-date drivers, drivers with updates available, or hardware not supported for automatic driver management.
- Driver Update Categories — which driver categories have updates pending.
Use these to identify whether patching and driver update automation is keeping up with the fleet, or whether manual intervention is needed.
Good to know
Section titled “Good to know”- The dashboard is read-only — all changes happen in the individual sections it links to.
- Widgets show No data to display when the relevant feature has no data yet, for example a fresh environment with no endpoints enrolled, or Privilege Manager not yet configured.
- The dashboard updates automatically; there is no manual refresh button.
- The Reliability and Privileges sections always cover the last three days (3D).
- The Reliability section is shown only with Experience Monitor, the Privileges section only with Privilege Manager, and the Endpoint Progress widget only with Application Manager or Provision Manager. The Applications and Drivers widgets are always shown, and show no data when your organization doesn’t use those features. See Roles and Product Access.
- Click a section title, such as Endpoints, Reliability, Privileges, Applications, or Drivers, to open that section’s own dashboard.