

Reliability
The Reliability section provides visibility into endpoint stability across your organization by analyzing system and application event logs. It helps administrators identify instability trends, investigate recurring issues, and maintain consistent endpoint performance.
You find it under Windows → Experience on the Reliability tab, and on the Experience tab of each endpoint.
Reliability events
Section titled “Reliability events”Two types of reliability events are monitored:
- Application Events – Related to installed programs and third-party software, from the Windows Application log
- System Events – Related to Windows system components such as drivers and built-in system elements, from the Windows System log
Each event is categorized by severity:
- Critical
- Error
- Warning
This classification makes it easier to identify problematic endpoints and prioritize investigation.
Reliability Score
Section titled “Reliability Score”The Reliability Score is a numerical indicator of endpoint stability, indexed from 1 to 10.
As the number and severity of errors increase, the Reliability Score decreases. Maintaining a high score helps ensure stable systems and consistent user productivity across your environment.
Scores are grouped into four ranges:
| Range | Score |
|---|---|
| Good | 8.5 to 10 |
| Fair | 7 up to 8.5 |
| Poor | 5 up to 7 |
| Unacceptable | 1 up to 5 |
Average Reliability Score chart
Section titled “Average Reliability Score chart”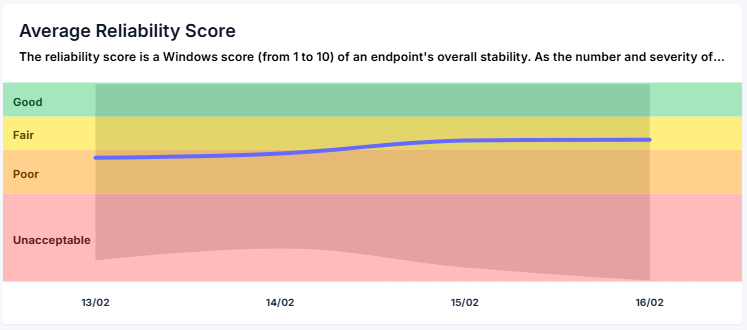
The Average Reliability Score chart provides a historical view of stability over time.
The blue line represents the average Reliability Score, while the shaded band shows the lowest and highest score among endpoints. The colored background bands mark the Good, Fair, Poor, and Unacceptable ranges.
When viewing all devices, the displayed score represents the average reliability across the organization.
Hovering over a point in time displays:
- Time period – The selected interval
- Reliability Score · Average – Organizational average for that period
- Reliability Score · Range – Lowest and highest score among endpoints
- Endpoint count – Number of endpoints included in the calculation
Clicking a time point drills down and filters results to that specific period.
Reliability Score for Latest Hour
Section titled “Reliability Score for Latest Hour”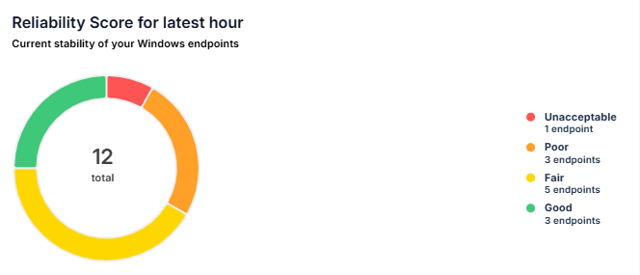
The Reliability Score for Latest Hour pie chart shows how many endpoints are in each score range right now.
Selecting a segment displays the list of devices within that stability range, enabling targeted investigation and remediation.
On a single endpoint’s Experience tab, the Latest Reliability Score widget shows the endpoint’s current score and range instead.
Event Timeline
Section titled “Event Timeline”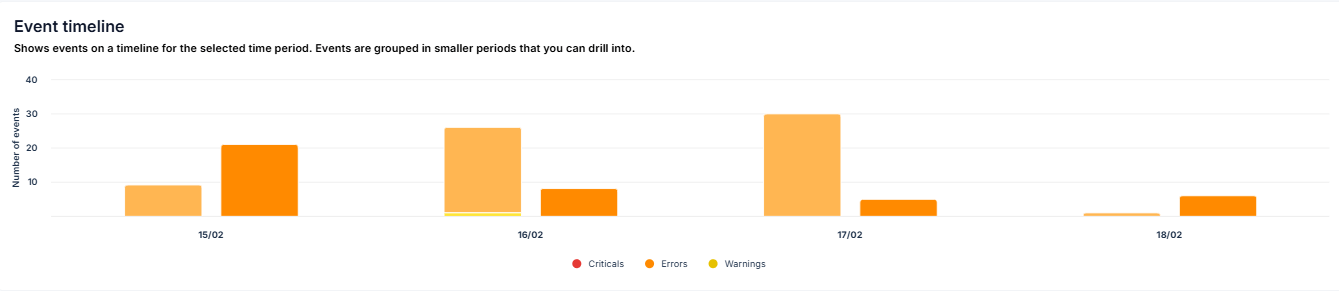
The Event Timeline provides a time-based overview of event distribution by severity.
Each bar represents the number of:
- Critical events
- Error events
- Warning events
Hovering over a bar displays the time period, the number of events per severity, and the number of affected endpoints.
Clicking a bar drills down and filters results to the selected time period.
Below the timeline, the Criticals, Errors, and Warnings tiles show the number of events of each severity in the period, and how many endpoints are affected. Select a tile to open the Event Log for that severity.
Endpoints with the most events
Section titled “Endpoints with the most events”
The Most Criticals, Most Errors, and Most Warnings lists show the endpoints with the highest number of events in each severity. Each row shows the Endpoint, its Application and System events, and the total Event count.
Selecting an endpoint redirects you to that endpoint’s event logs for detailed analysis.
Filters
Section titled “Filters”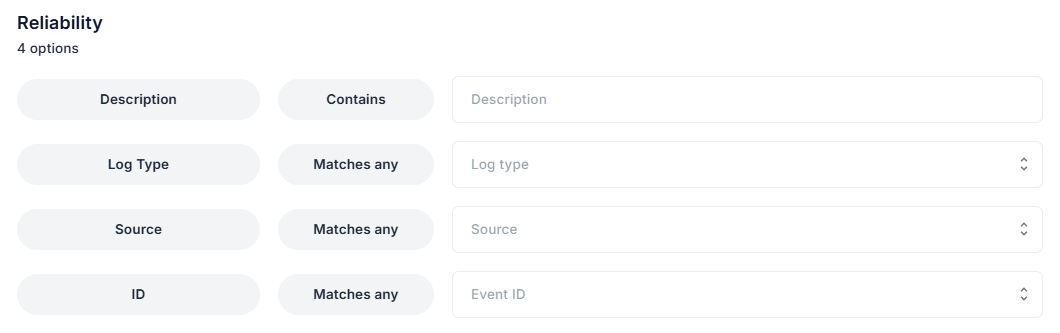
Filtering options allow administrators to narrow results and focus on the most relevant reliability data. Access filters using the filter icon in the upper-right corner.
Available filters include:
- Description – Full-text search within event descriptions
- Log Type – Filter by Application or System events
- Source – Filter by event source
- ID – Filter by specific event IDs
Events can also be filtered directly by selecting an endpoint in one of the Most lists or by clicking a severity category.
Time period and detailed view
Section titled “Time period and detailed view”
Use the time selector in the upper-right corner to define the reporting range:
- Today
- 3D – the last three days
- 7D – the last seven days
- 1M – the last month
- 3M – the last three months
Under Windows → Experience, you can select Today or 3D. The longer periods are available on an endpoint’s Experience tab, if your Experience Monitor contract keeps data that long.
Reliability data can also be viewed in two modes:
- Summary – Combines Application and System events into a unified view
- Detailed – Separates Application and System events for deeper analysis