

Event Log
Experience Monitor’s Event Log provides visibility into system and application events collected from endpoints across the organization. It enables administrators to investigate reliability issues, identify recurring errors, and analyze event patterns affecting endpoint stability.
You find it under Windows → Experience on the Event Log tab, and on the Experience tab of each endpoint. You can also open it by selecting a severity tile or an endpoint on the Reliability tab.
Event Timeline chart
Section titled “Event Timeline chart”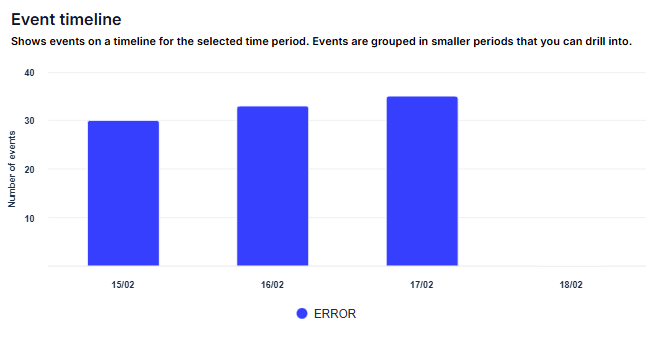
The Event Timeline chart shows events on a timeline for the selected period, grouped into smaller intervals that you can drill down into.
Each bar represents the number of events recorded for the selected severity level:
- Critical
- Error
- Warning
Hovering over a bar displays:
- Time period – The selected time interval
- The number of events recorded during that period
- Affected endpoints – The number of endpoints impacted. Not shown on an endpoint’s own page.
Clicking a bar drills down and filters results to the selected time range for deeper analysis.
Event sources
Section titled “Event sources”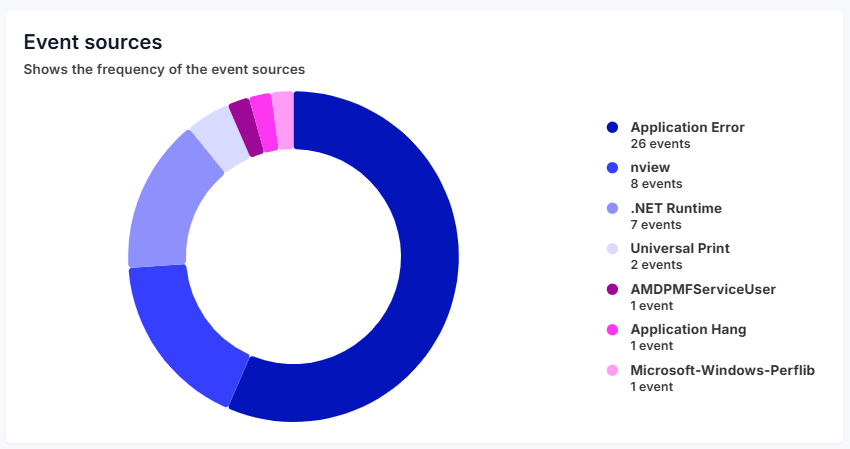
Next to the timeline, the Event Sources pie chart displays the distribution of events by source for the selected period, severity, and filters.
The chart shows how much each source contributes to the total event volume. Selecting a source filters the results accordingly, allowing focused troubleshooting.
Event list
Section titled “Event list”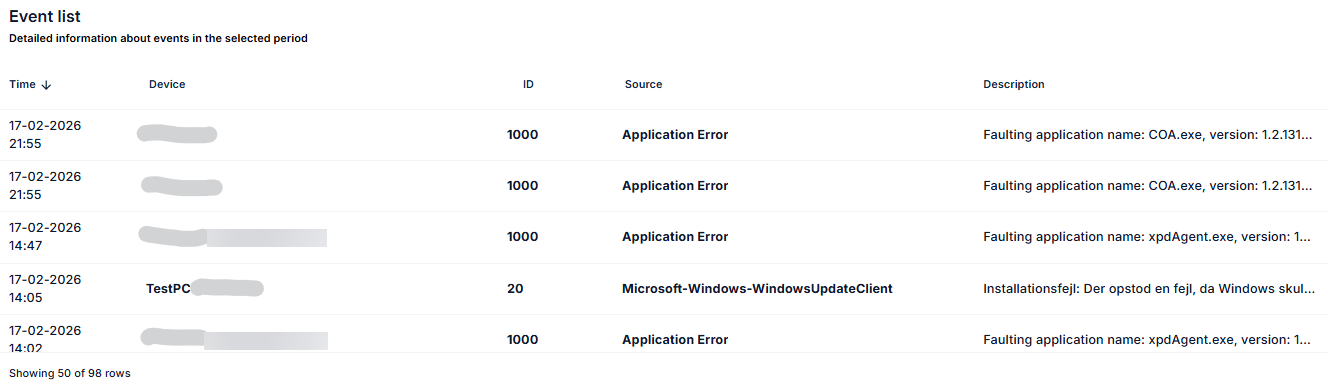
The Event List displays all logged events based on the selected filters and severity.
Each entry includes:
- Time – When the event was logged
- Device – The endpoint where the event occurred. Select it to open the endpoint. Not shown on an endpoint’s own page.
- ID – The event ID. Select it to filter the list by that ID.
- Source – The application or system component generating the event. Select it to filter the list by that source.
- Description – Detailed event information. Select it to read the full description.
Select a column header to sort the list.
Severity selector
Section titled “Severity selector”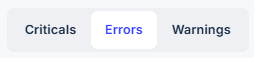
The Severity Selector allows you to switch between:
- Criticals
- Errors
- Warnings
Changing the severity clears the filters.
This enables quick prioritization and focused analysis of the most impactful issues.
Filters
Section titled “Filters”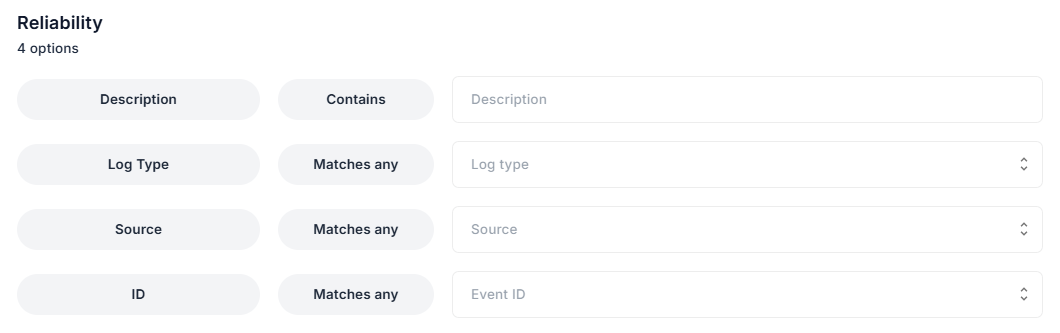
Advanced filtering options allow you to narrow results to the most relevant events.
Click the filter icon in the upper-right corner to access filtering options, including:
- Description – Full-text search based on the event description
- Log Type – Filter by Application or System events
- Source – Filter by event source
- ID – Filter by specific event IDs
You can also filter by clicking a severity category.
Time period
Section titled “Time period”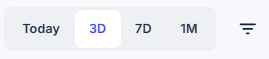
Use the time selector in the upper-right corner to define the reporting range:
- Today
- 3D – the last three days
- 7D – the last seven days
- 1M – the last month
- 3M – the last three months
Under Windows → Experience, you can select Today or 3D. The longer periods are available on an endpoint’s Experience tab, if your Experience Monitor contract keeps data that long.
This allows administrators to analyze event activity across different time intervals and identify reliability trends.