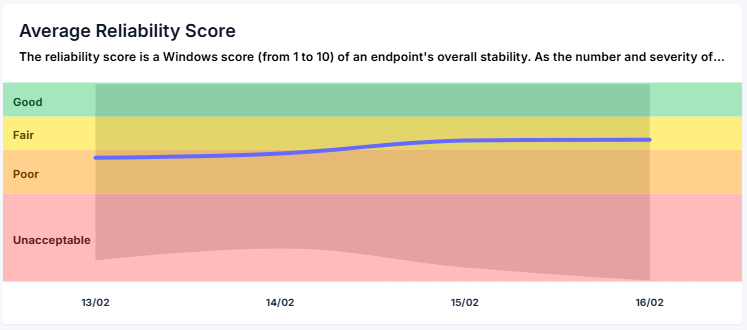
The Reliability Score Chart provides a historical view of stability over time.
The blue line represents the average Reliability Score, while the color distribution reflects the stability range across endpoints.
When viewing all devices, the displayed score represents the average reliability across the organization.
Hovering over a point in time displays:
- Time Period – The selected interval
- Average Reliability Score – Organizational average for that period
- Reliability Score Range – Lowest and highest score among endpoints
- Device Count – Number of devices included in the calculation
Clicking a time point drills down and filters results to that specific period.
